Overview
The Reporting page is your hub for every report available in Trella CRM — from daily activity summaries to conversion ratios, expense totals, mileage tracking, and more. Every report lives here, organized into sections by topic, with tools to search, favorite, run, export, and schedule delivery. Whether you are preparing for a Monday morning team review or tracking a rep's productivity over the past quarter, the Reporting page is where you start.
![]() For documentation on a specific report, see the article for that report in the Reports section of this Help Center. Links to each article are included at the bottom of this article.
For documentation on a specific report, see the article for that report in the Reports section of this Help Center. Links to each article are included at the bottom of this article.
![]() Reports can only be accessed through Trella CRM Web.
Reports can only be accessed through Trella CRM Web.
 In this Article
- The Reporting Page
- Finding a Specific Report
- Favorite Reports and My Saved Reports
- Opening a Report
- Features on an open Report page
- Filters
- Running a Report
- Exporting Your Data
- Saving Filter Sets
- Scheduling Reports
- Links to Specific Reports
The Reporting Page
| Click on the "Reporting" button in the left navigation to open the Reporting page. |  |
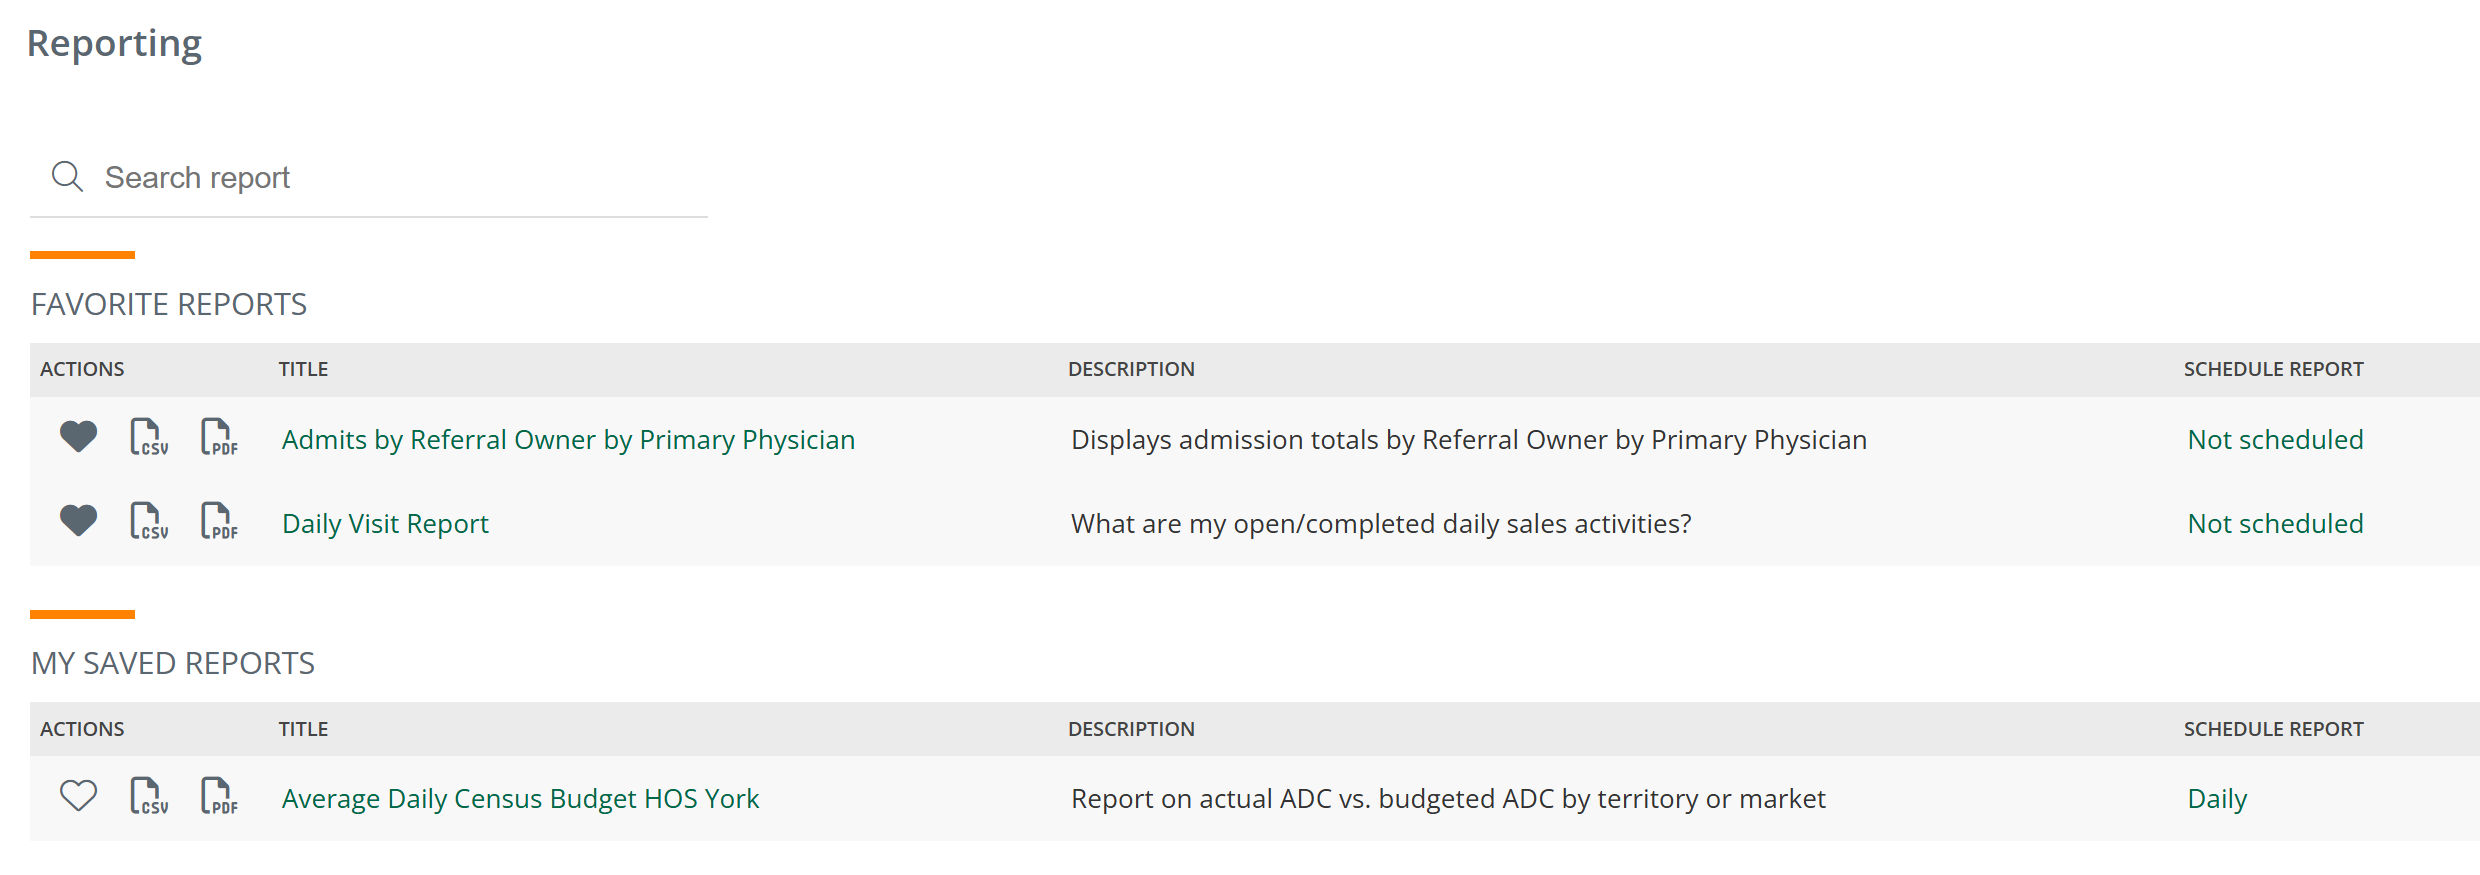
The Reporting page opens. The image below will be similar to what you will see. You might have different reports in the Favorite Reports section.
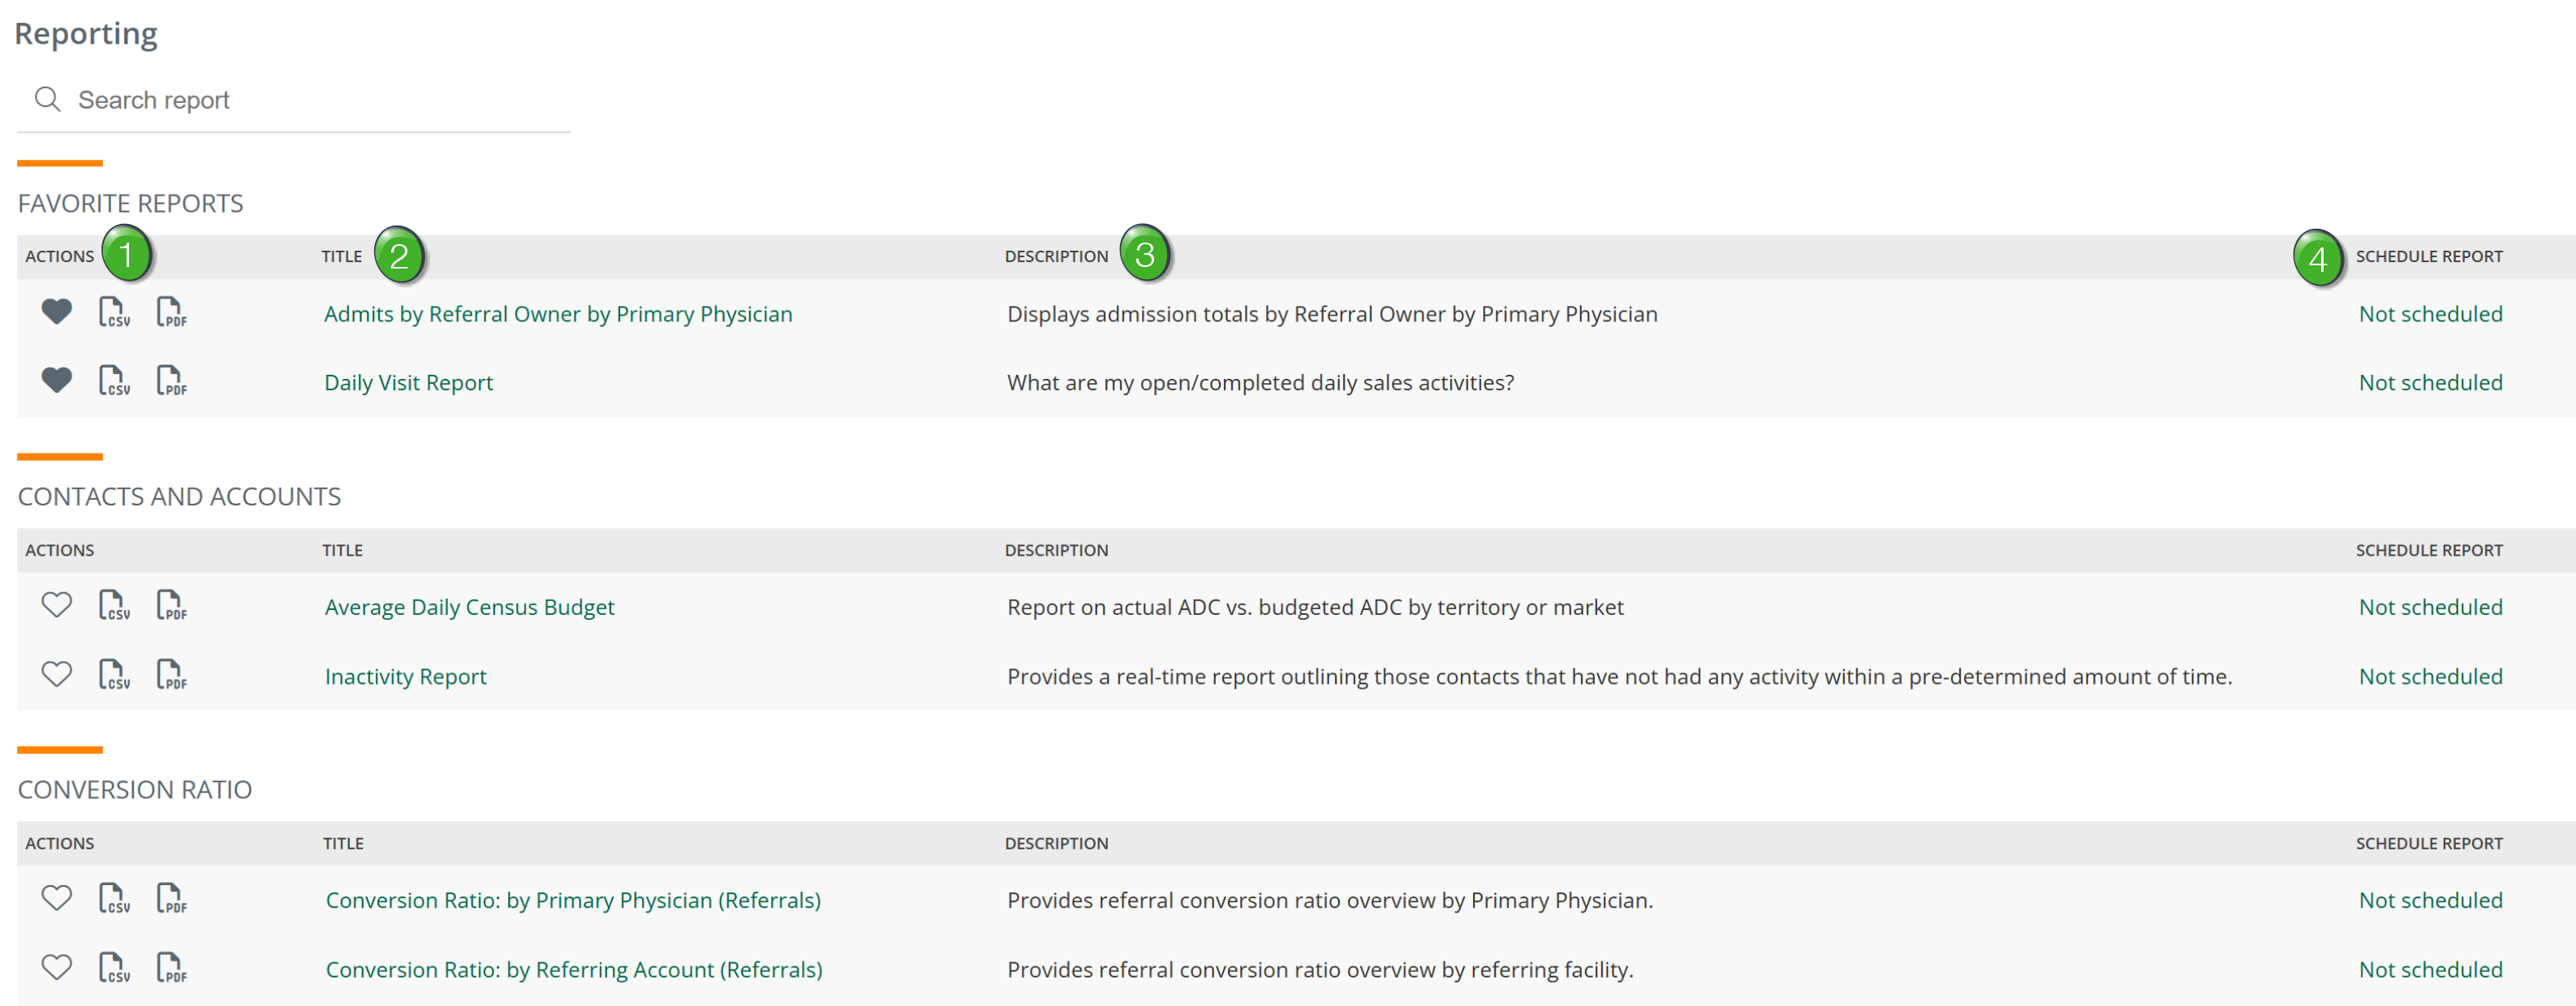
Each report row has four columns:
|
|
 |
Action Icon |
What It Does |
|---|---|
|
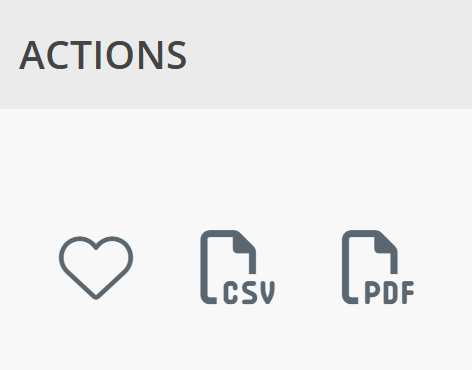
Heart |
Click to add the report to your Favorite Reports. The heart fills in when the report is a favorite. Click again to remove it. Favorited reports appear at the top of the Reporting page in the Favorite Reports section. |
CSV 
|
Downloads the report as a spreadsheet immediately, without opening it first. Uses the report's default filter settings. |
PDF 
|
Downloads the report as a PDF immediately, without opening it first. Uses the report's default filter settings. |
![]() Title — The name of the report.
Title — The name of the report.
![]() Click the report name to open it.
Click the report name to open it.
![]() Description— A brief description of what the report shows.
Description— A brief description of what the report shows.
![]() Schedule Report — Shows whether the report has been set up for automatic recurring delivery. Displays Not scheduled if no schedule is active, or the delivery frequency if one has been configured.
Schedule Report — Shows whether the report has been set up for automatic recurring delivery. Displays Not scheduled if no schedule is active, or the delivery frequency if one has been configured.
Finding a Specific Report
There are two ways to find a specific report on the reporting page.
Search
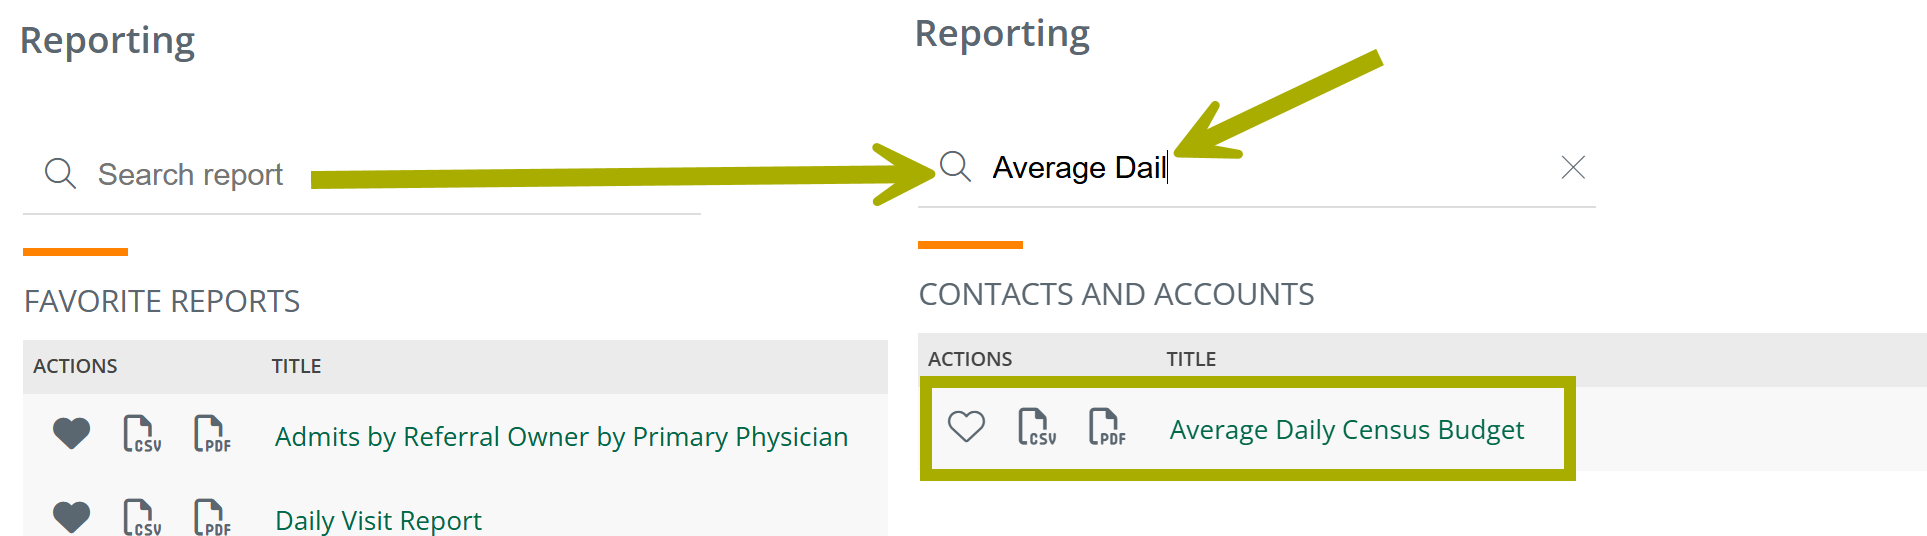
Type any part of a report name into the Search report field at the top left of the page. The list narrows as you type.
![]() You do not need to type the full report name — a few words are enough to find what you need. The image below shows an example of a partial search. (At least three characters are required for the search to work.)
You do not need to type the full report name — a few words are enough to find what you need. The image below shows an example of a partial search. (At least three characters are required for the search to work.)
Browse by section
Reports are organized into sections by topic. Scroll through the Reporting page to browse all available reports by category.
The sections and their summaries are included in the following table.
Section name |
What It Covers |
|---|---|
| Contacts and Accounts | Account and contact activity, inactivity, and average daily census tracking. |
| Conversion Ratio | Referral and order conversion rates by physician, account, time period, and user. |
| Events | Daily visit activity, event summaries, and daily task tracking. |
| Expenses | Account expenses, marketer expenses, itemized expenses, and Stark II budget tracking. |
| Leads | Lead engagement by status, source, and business line. |
| Mileage | Travel distance based on completed events and user check-ins. |
| Orders | Deliveries and order activity by owner, physician, and referring facility. |
| Owner Change | Requests to reassign contact, account, or referral ownership — with tools to approve or deny requests directly from the report. This includes approving and denying requests to add and remove ownership of records. |
| Referrals | Admission totals, referral activity, and referral-to-admission time by user and facility. |
| Sales Productivity | AE productivity, account and contact engagement, territory activity, and coaching sessions. |
| Usage | User adoption, application usage, and trend analysis. |
| Users | Users not assigned to a sales territory. |
![]() At any time, you can click on the report name to open the report.
At any time, you can click on the report name to open the report.
Favorite Reports and My Saved Reports
Favorite Reports — Reports you have marked with the heart icon  appear in the Favorite Reports section at the top of the Reporting page. This is the fastest way to reach your most-used reports — no searching or scrolling required. Your favorites are personal to your account and do not affect what other users see.
My Saved Reports — Reports you have saved with a custom filter set (using Save As... from within a report) appear here. Each saved report opens with the filters you saved, ready to run without reconfiguring.
![]() See Saving Filter Sets for more.
See Saving Filter Sets for more.
Opening a Report
Click the report name to open the report. The Reporting page transitions to the specific report details page, where you can review the filters, adjust them if needed, and run the report.
Features on an open Report page
When you open a report, whether it is a standard report or a custom one you created, you will see many of the same features that are described below. Every report page in Trella CRM has the same basic layout.
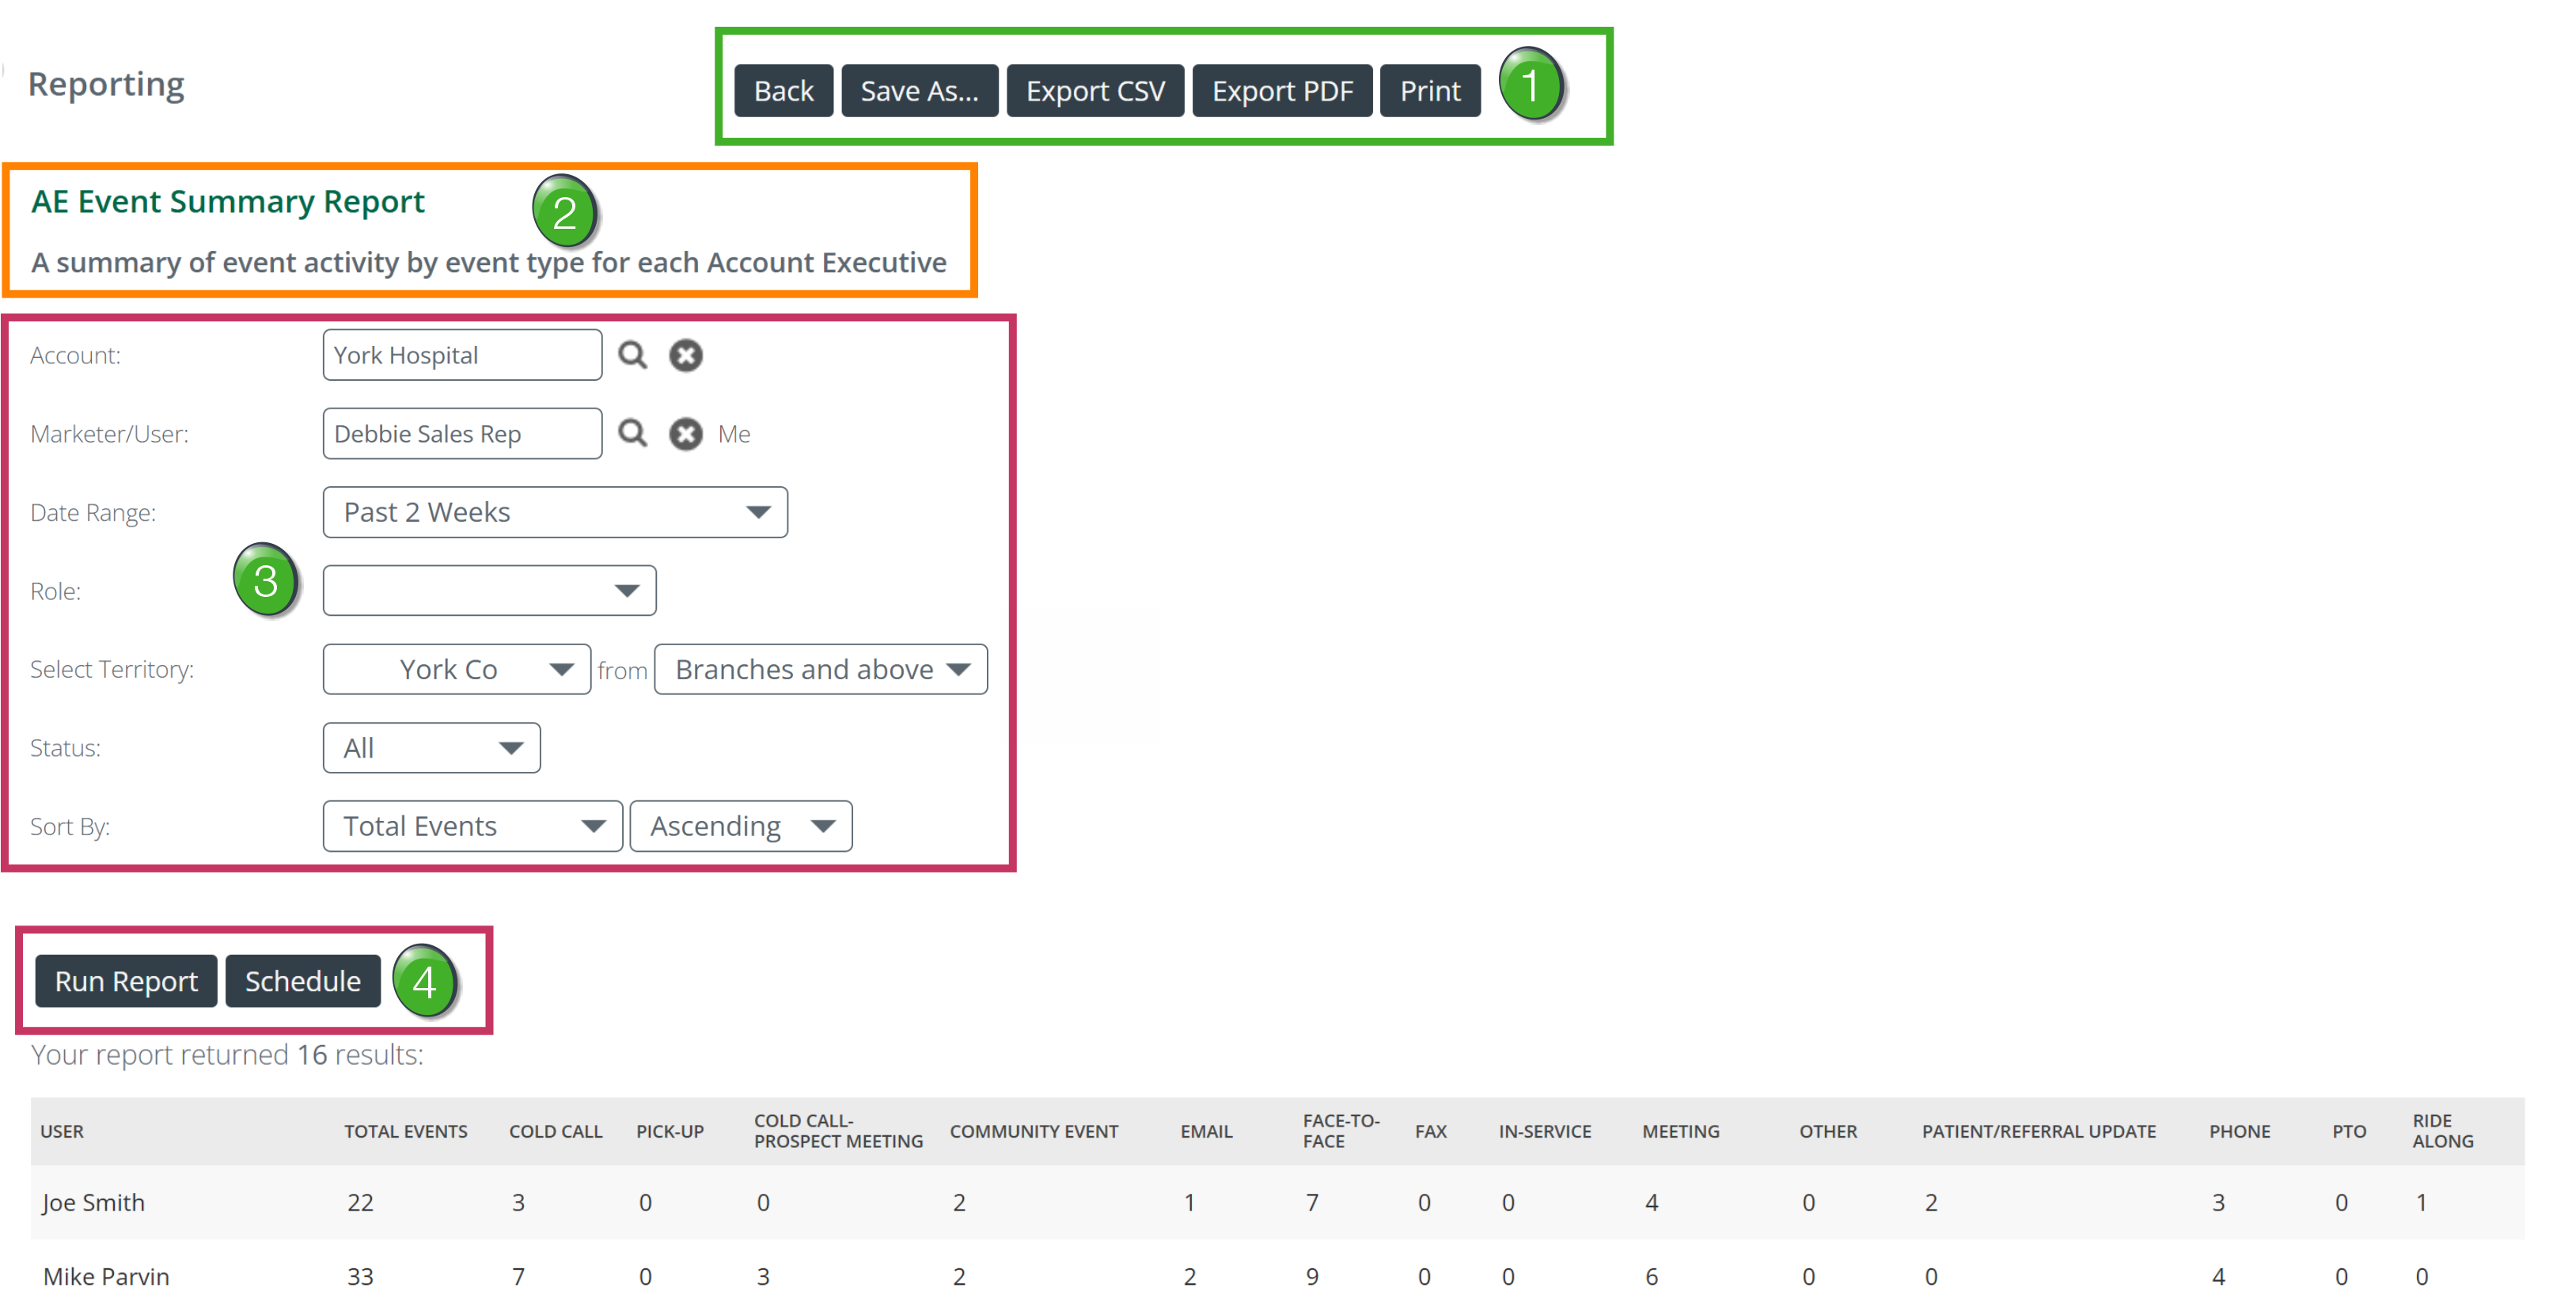
![]() Top buttons — There are five different possible buttons. Not every report has all five, but the descriptions below will provide their basic functions for when you do see them.
Top buttons — There are five different possible buttons. Not every report has all five, but the descriptions below will provide their basic functions for when you do see them.
Button |
What It Does |
|---|---|
| Back | Returns you to the Reporting page. |
| Save As... | Saves the current filter configuration as a named saved report. The saved report appears in your My Saved Reports section. See Saving Filter Sets. |
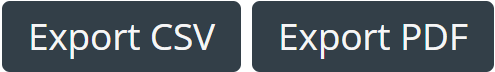
| Export CSV | Downloads the report data as a spreadsheet file using your current filter settings. You can open the file in Excel to slice the data any way you want. |
| Export PDF | Downloads a formatted PDF of the report using your current filter settings. |
| Prints the current report results. |
![]() Report title and description — The report name appears in bold at the top of the content area. The description below it summarizes what the report shows and who it is designed for.
Report title and description — The report name appears in bold at the top of the content area. The description below it summarizes what the report shows and who it is designed for.
![]() Filters — Controls that let you narrow the report to the specific data you need. Every report includes a Date Range filter and a Sort By filter. Additional filters vary depending on the report. See Filters below, and the article for each specific report for full filter documentation.
Filters — Controls that let you narrow the report to the specific data you need. Every report includes a Date Range filter and a Sort By filter. Additional filters vary depending on the report. See Filters below, and the article for each specific report for full filter documentation.
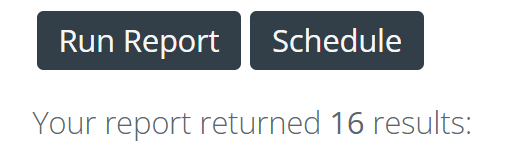
![]() Run Report and Schedule — Two buttons at the bottom of the filter section. Run Report refreshes the results table with your current filter selections. Schedule sets up automatic recurring delivery. See Scheduling Reports.
Run Report and Schedule — Two buttons at the bottom of the filter section. Run Report refreshes the results table with your current filter selections. Schedule sets up automatic recurring delivery. See Scheduling Reports.
Filters
Filters let you narrow the report results to the time period, user, territory, or other criteria you need. Set your filters, then click Run Report to apply them.
There are many different filters that you will see throughout Trella CRM, and many of the interface features you see in the filters are used as part of other tools throughout the CRM. Which filters you will see in any chosen report will vary. Use the details below to become familiar with the way these tools function.
Filter |
What It Does |
|
|---|---|---|
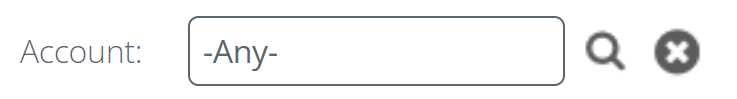
| Account |
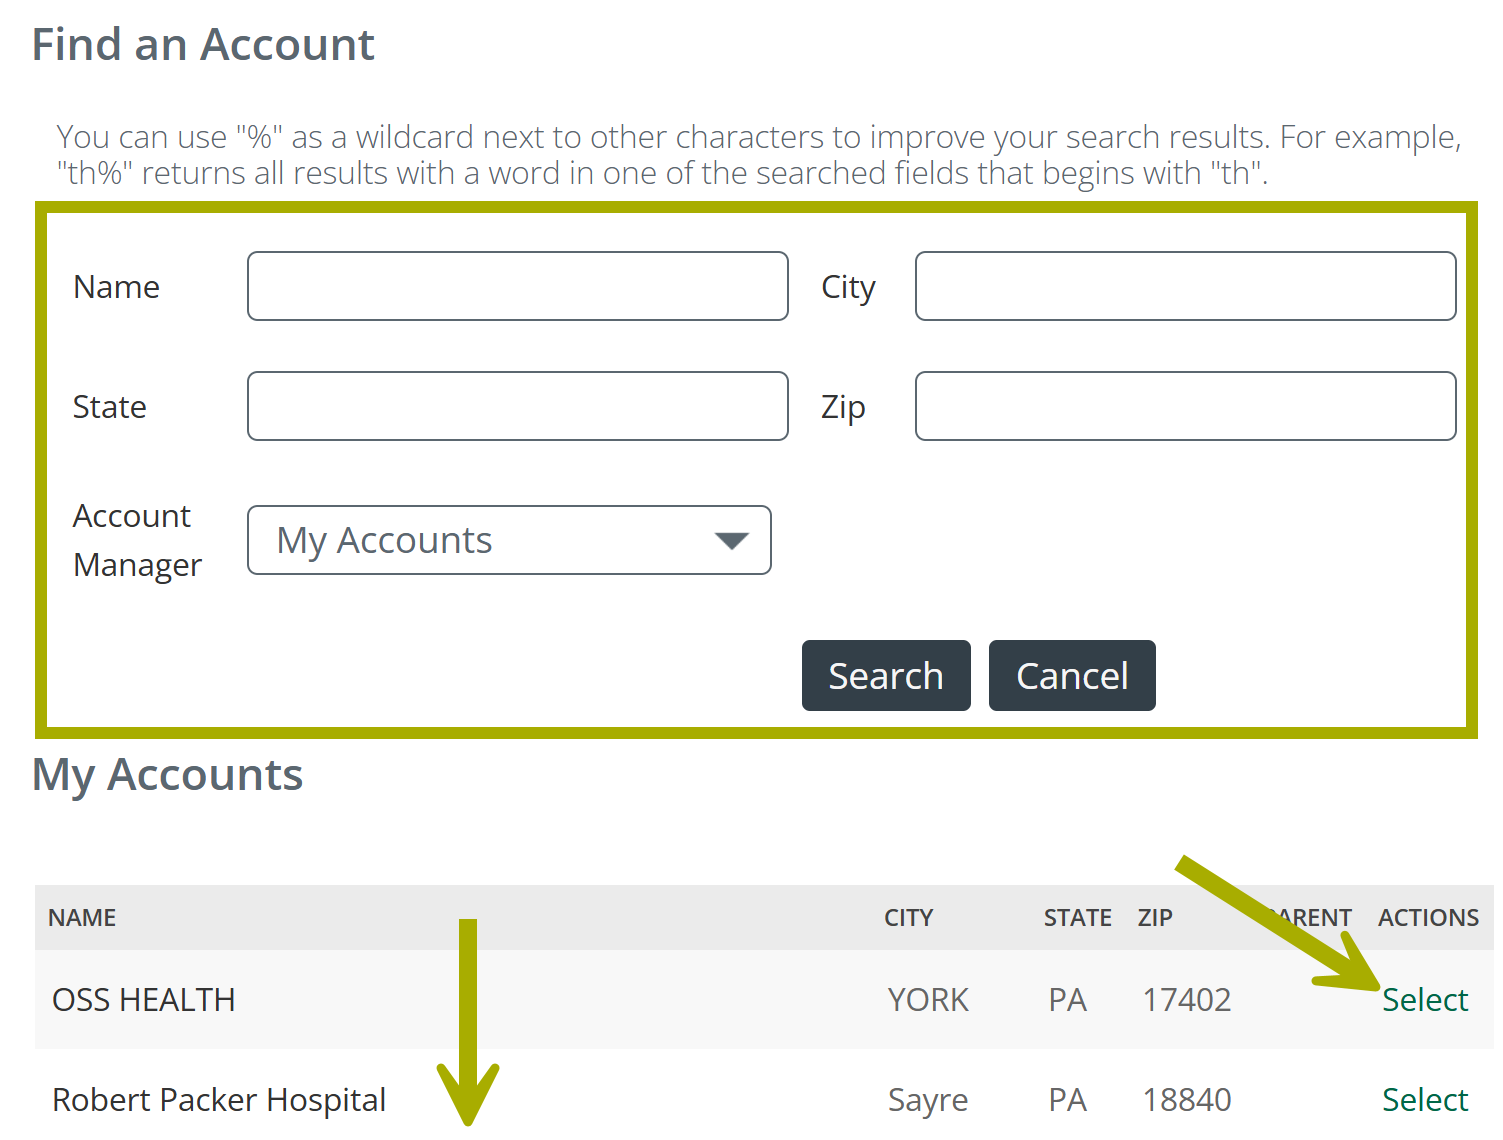
This filter narrows the report to events logged for a specific account. Use this filter when you want to see all activity your team has logged at one referral account source.
The table will then show results connected to the chosen account.
|
 |
 | ||
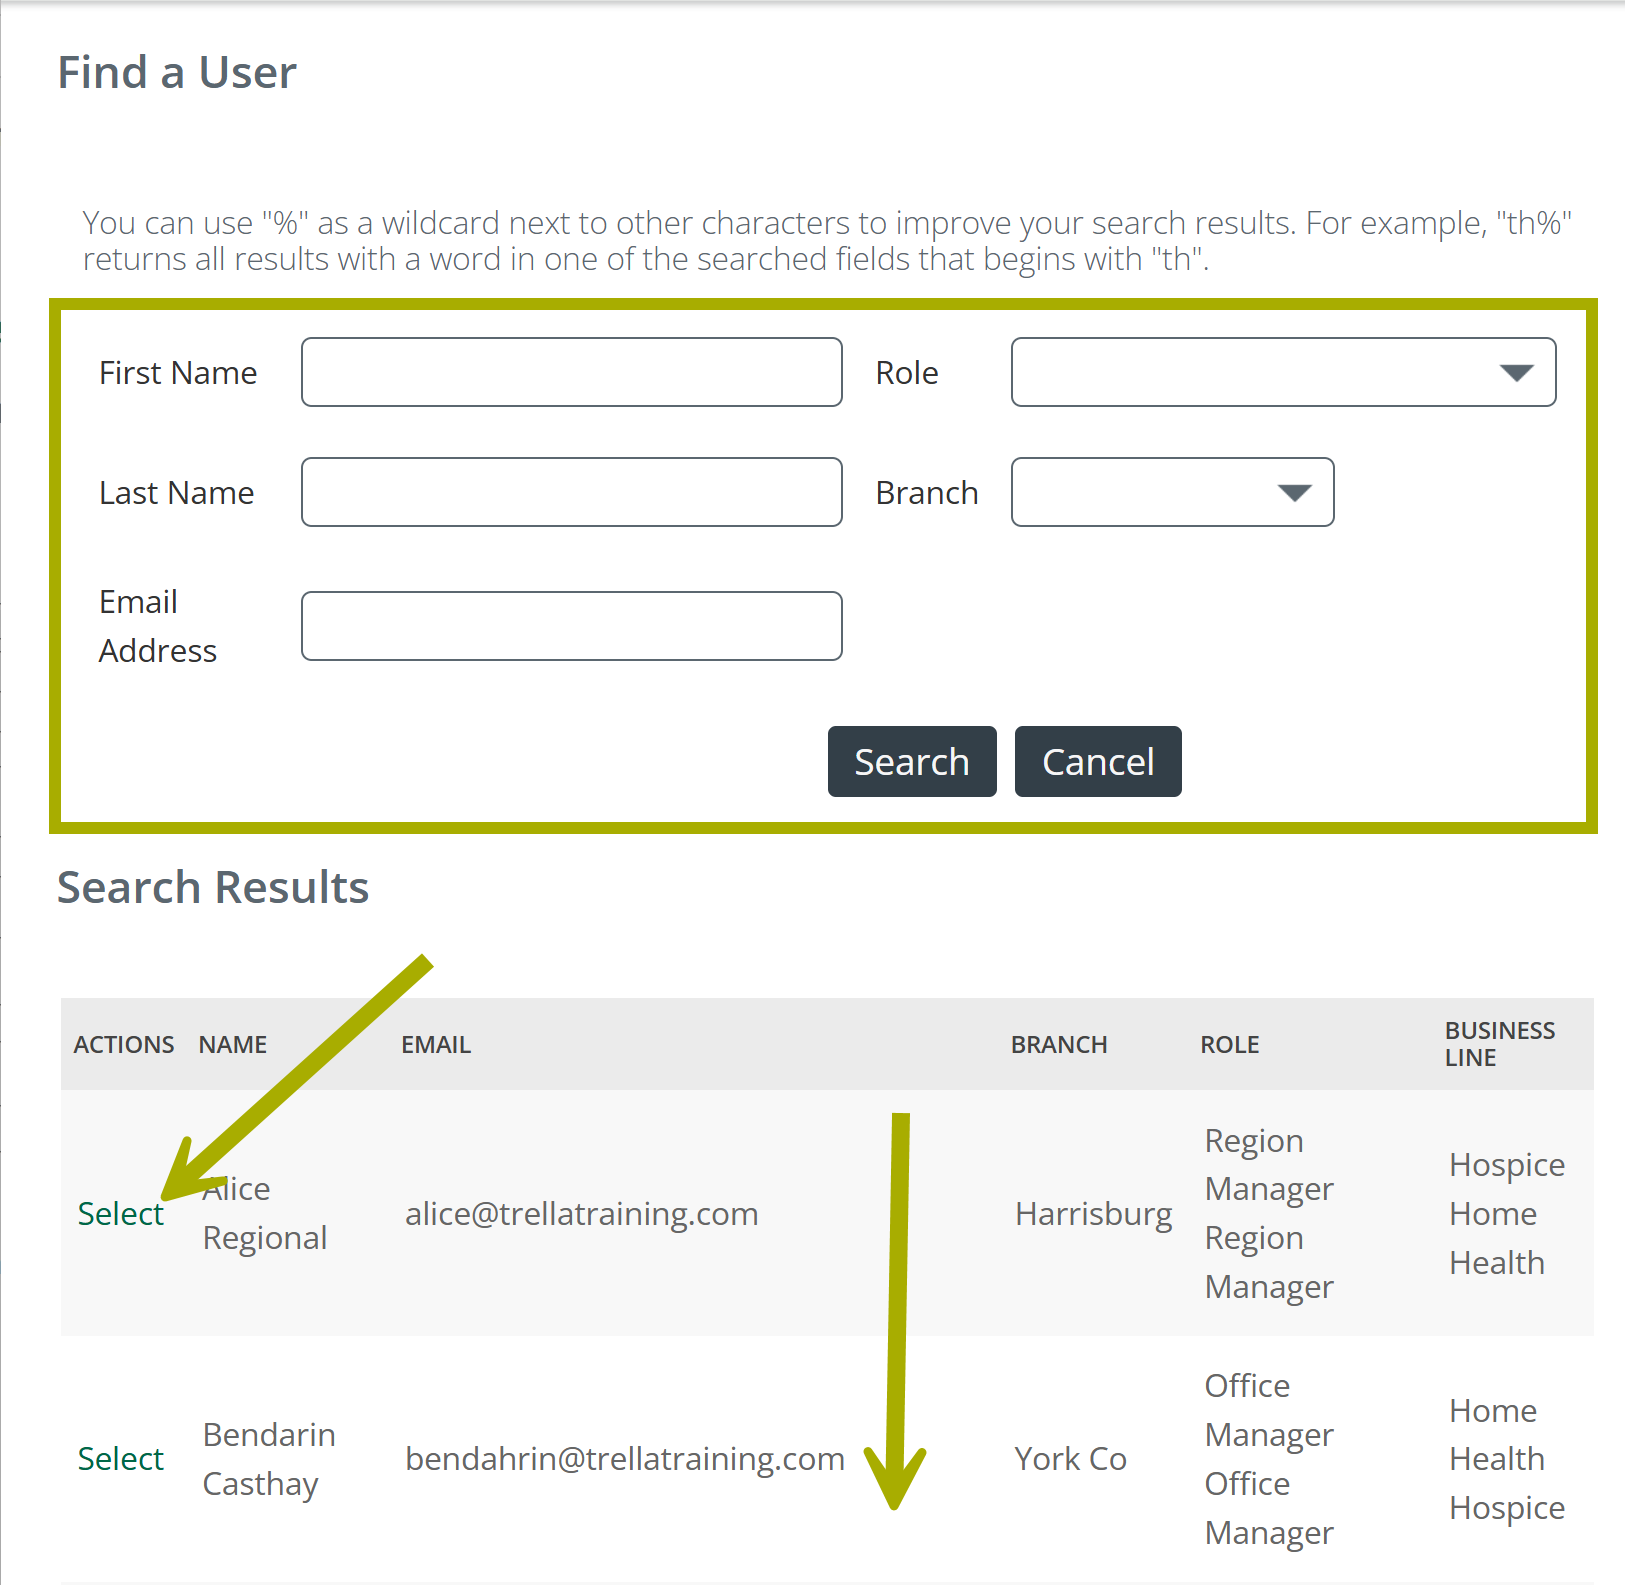
| Marketer/User |
This filter limits the results in the report to events logged for a specific user. Use this filter when you want to see all activity for the chosen user.
The table will then show results connected to the chosen user.
|
 |
 | ||
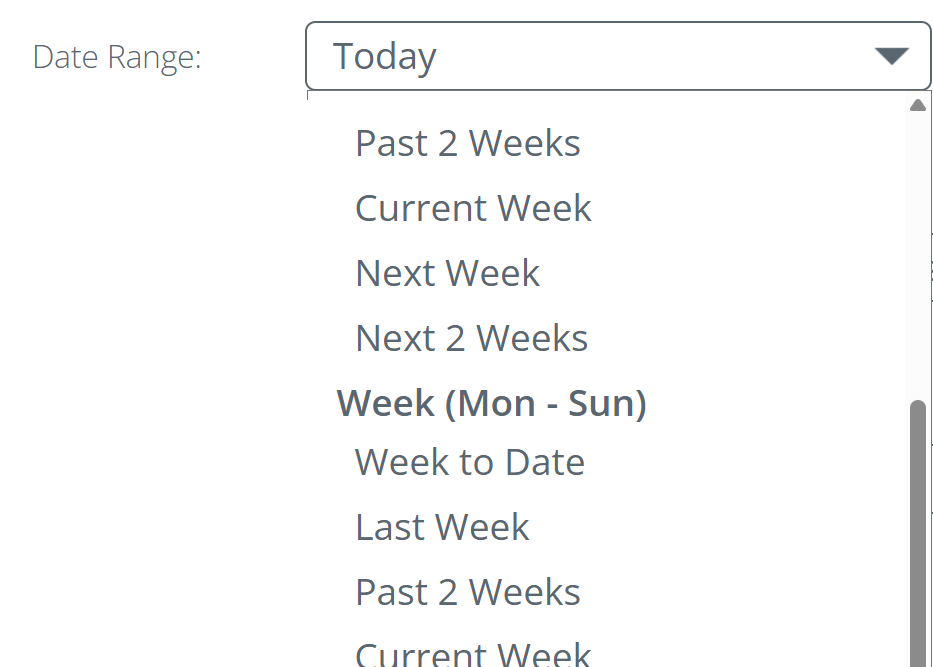
| Date Range |
Sets the time window for the report. Common choices include Today, Last Week, Month to Date, Last Month, Year to Date, and Within a Range for a custom window.
|
 |
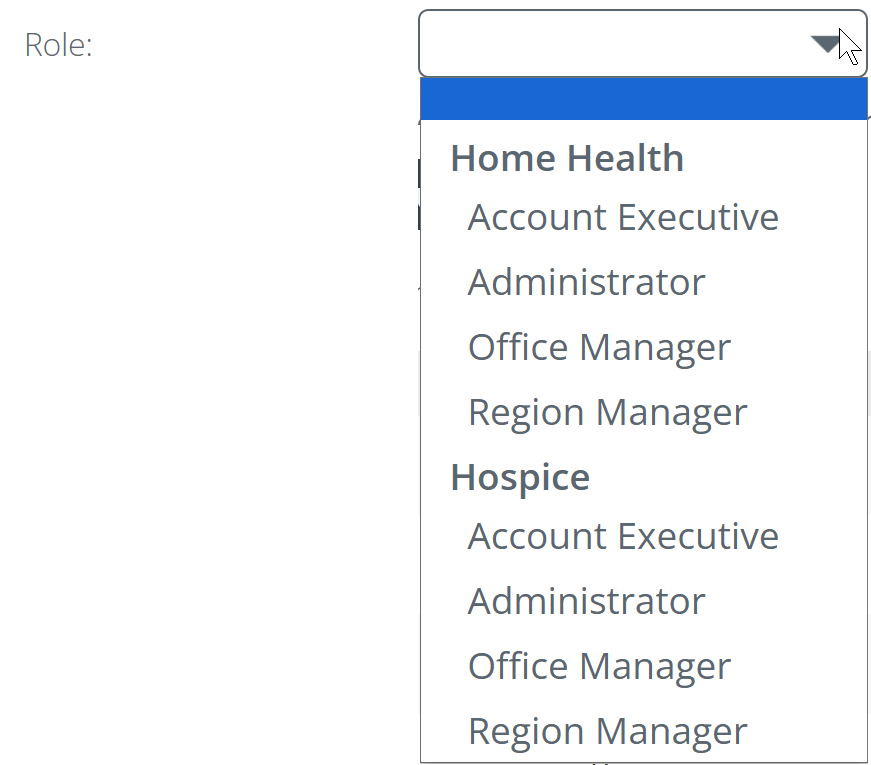
| Role |
This filter allows you to limit the results to a specific role type. Select Account Executive to see only AE activity, or leave open to include all roles on your team.
|
 |
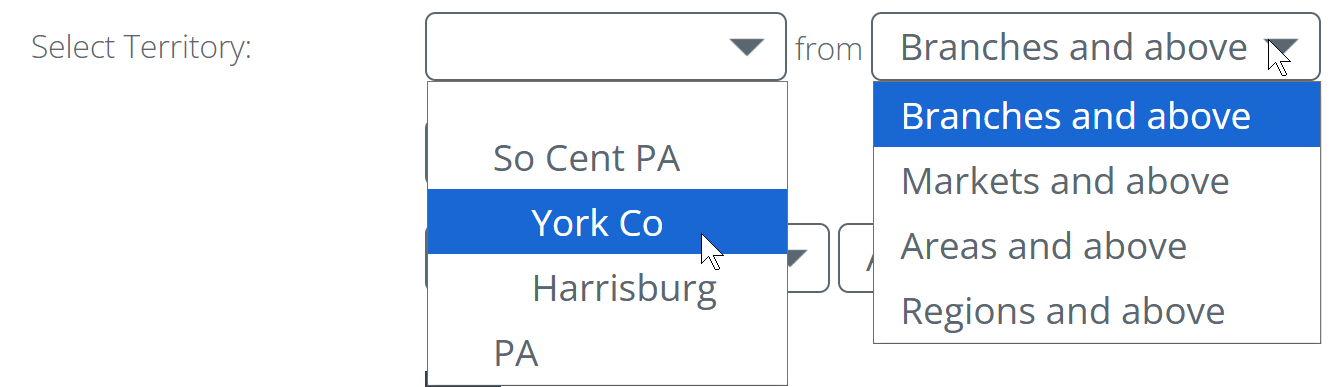
| Select Territory |
This filter scopes the report to a specific territory or territory level. Useful when you oversee multiple markets or regions and need to isolate one.
|
 |
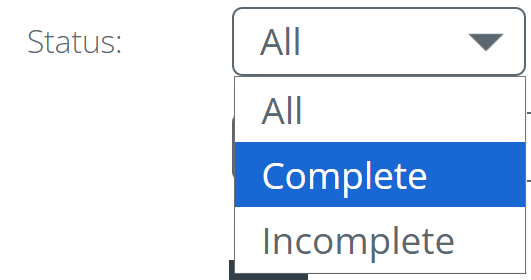
| Status |
Controls whether the report shows completed events, incomplete events, or both.
|
 |
| Sort By |
This filter sorts the table by a specific column. Use the second dropdown to choose Ascending or Descending order.
|
|
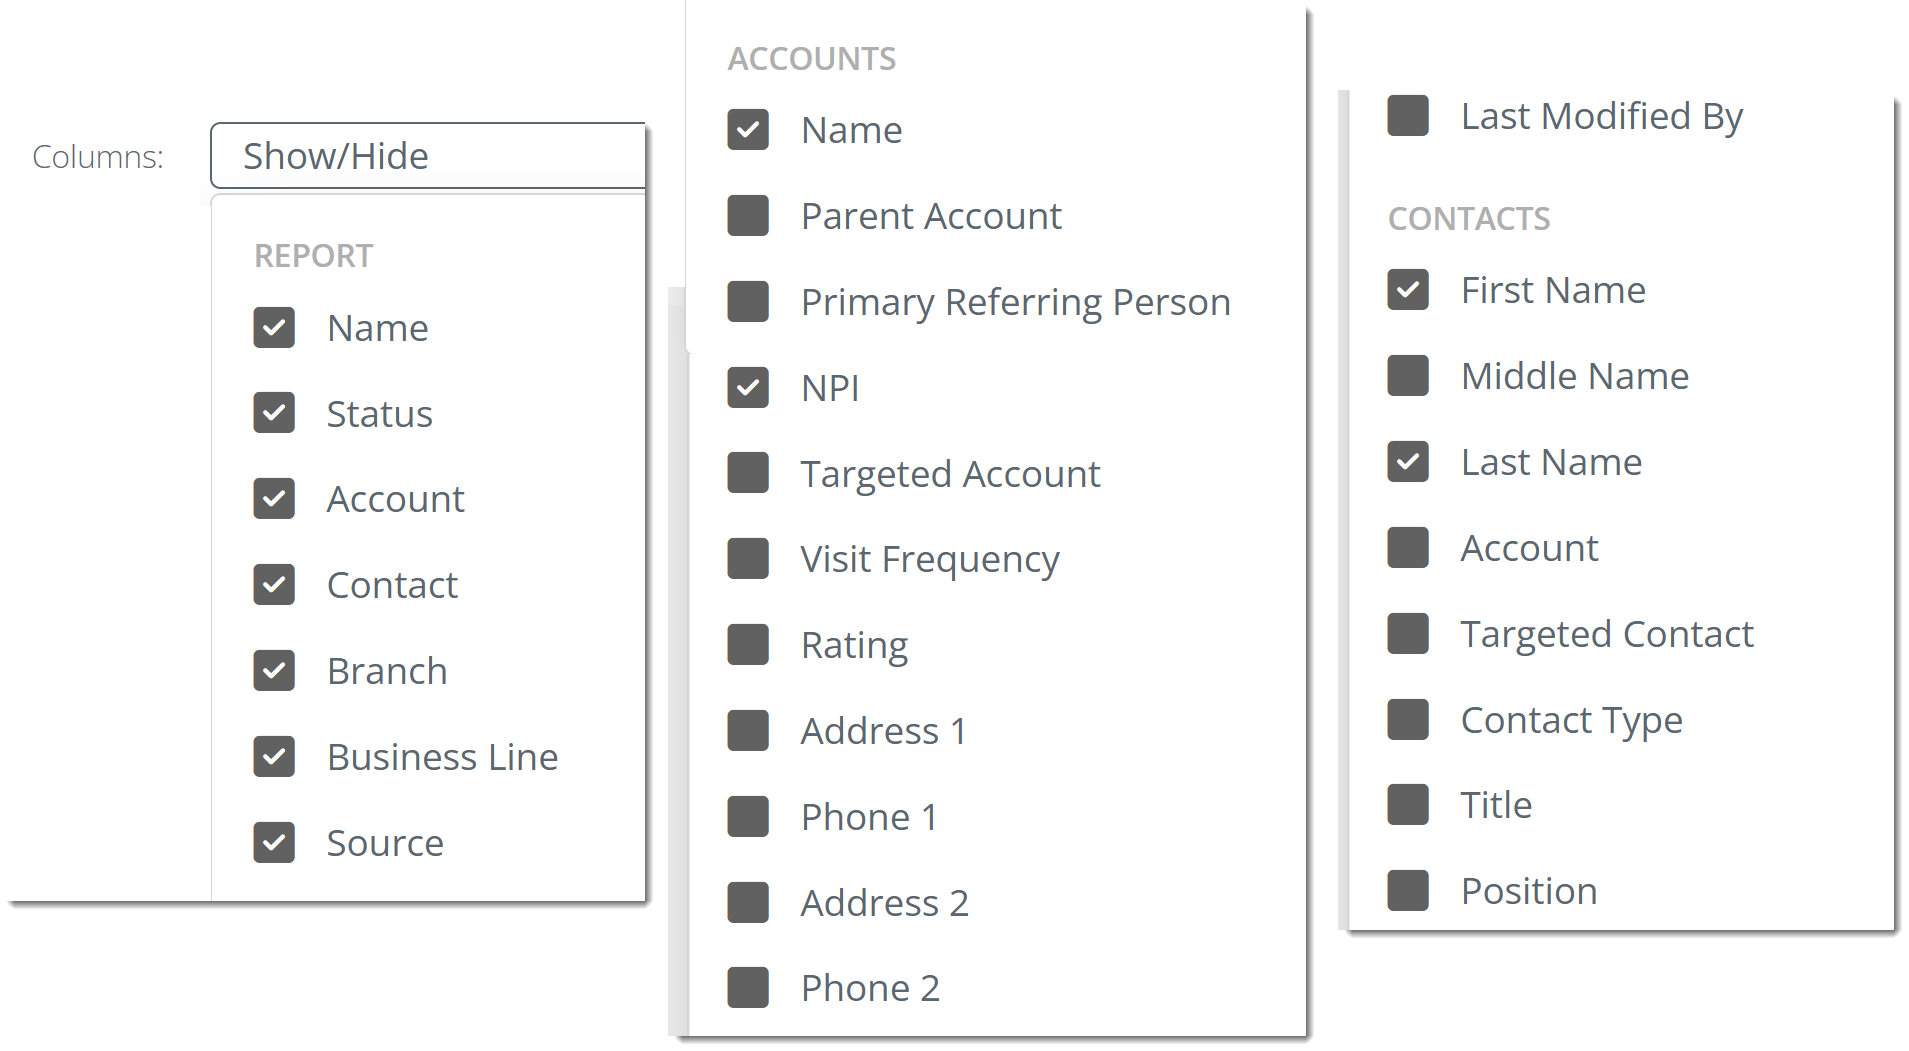
| Columns |
The Columns filter provides the ability to add or remove columns from the report. Not all reports have this filter, but some reports allow you to view and export a large number of different metrics. The filter may be broken up into categories.
|
|
 This filter works well together if you use it with the territory filter to focus on a specific role in a specific location.
![]() Some reports require a specific filter to be set before the report will return results.
Some reports require a specific filter to be set before the report will return results.
Running a Report
After setting your filters, click Run Report. The results table updates to reflect your selections. If you have not changed any filters, clicking Run Report re-runs the report with its current settings — useful when you want to refresh results with the most current data.

The results table includes a display selector (10 / 25 / 50 / 100 / 250 / 500) to control how many rows appear per page, and Previous / Next buttons to navigate between pages.
Exporting Your Data
Any report in Trella CRM can be exported as a spreadsheet or PDF. There are two ways to do this — both produce the same output.
| Method | How | When to Use |
|---|---|---|
| From the Reporting page |
Click the CSV or PDF icon in the ACTIONS column next to any report name.
|
When you want to download quickly using the report's default filter settings — no need to open the report first. |
| From within the report |
Open the report, set your filters, run it, then click Export CSV or Export PDF from the top buttons.
|
When you want to export with specific filters applied — for example, a single territory over a custom date range. |
CSV — Downloads the report data as a spreadsheet (.csv file). Open in Excel or another spreadsheet application for further analysis, team tracking, or combining with other data sources.
PDF — Downloads a formatted, printable version of the report. Useful for sharing in meetings or attaching to coaching notes.
Saving Filter Sets
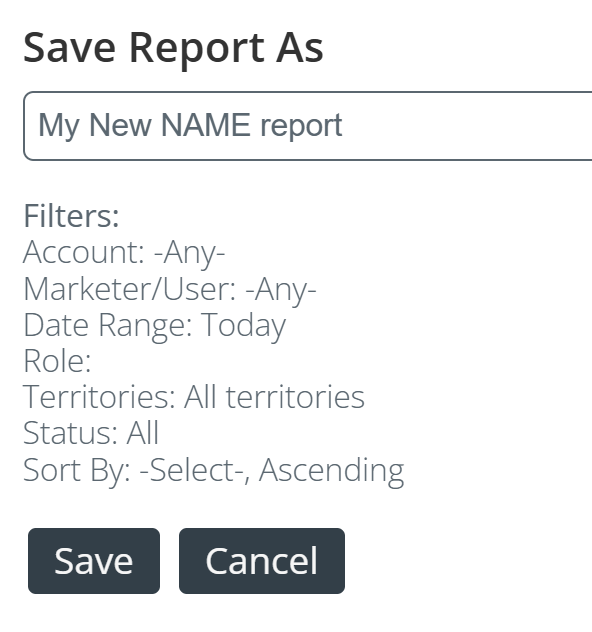
If you regularly run the same report with the same filter configuration, use Save As... to save that setup. Click Save As... from the top buttons, give the saved report a name, and save it. The saved report appears in the My Saved Reports section on the Reporting page.
|
After you have made changes to the filters, if you want to save the settings as a custom report, click on the "Save As..." button at the top of the page.
The interface shown to the right opens.
The current filter settings are shown below the name field. |
 |

![]() Clicking a saved report opens it with your filters already applied — ready to run without reconfiguring.
Clicking a saved report opens it with your filters already applied — ready to run without reconfiguring.
Scheduling Reports
The Schedule button on any report page sets up automatic recurring delivery. Choose your delivery frequency and recipients, and the report is sent to the designated inboxes on the schedule you configure — no manual running required. Use the following steps to schedule the chosen report.
|
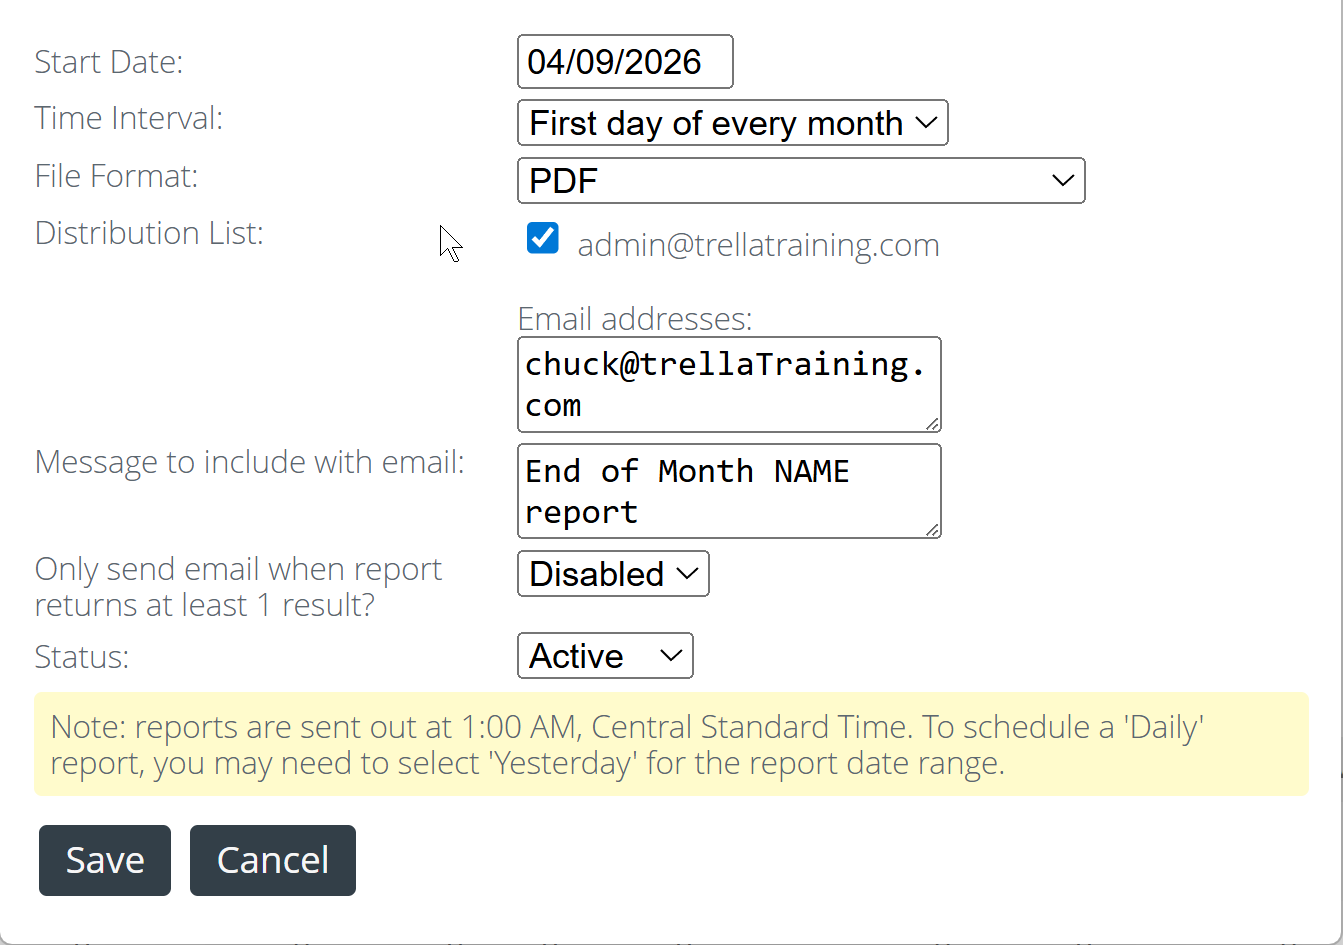
Schedule When you click on the "Schedule" button, the interface shown at right opens.
Details for each remaining setting are below. |
 |
|
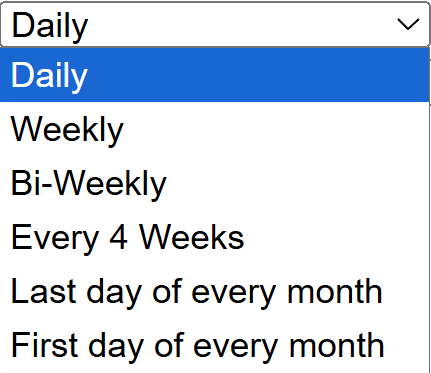
Time Interval
|
 |
|
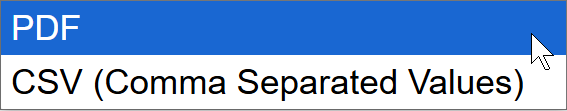
File Format
|
 |
|
Distribution List - You select who gets the report emailed to them. Your own email address will appear in the panel with a check box.
| |
|
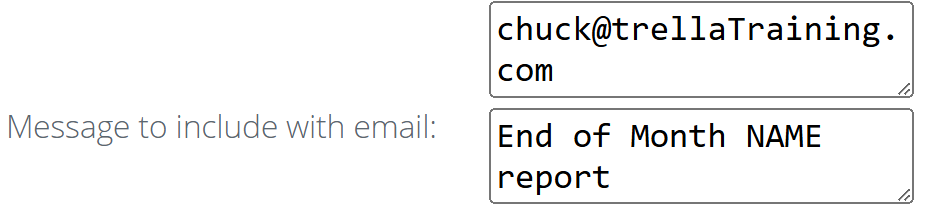
Email Addresses You can add as many email addresses as you want to the top field.
"NAME" in the image indicates the place to enter what you want to call the address so that the recipient knows what they are getting. |
 |
|
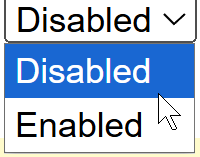
Only send email when report returns at least 1 result? If enabled, the report will only be sent if there is at least one result in the report If disabled, the report will be sent even if there are no results to include - it is merely a reminder that the report matters.
|
 |
|
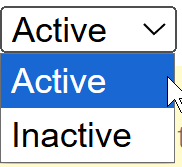
Status: Active vs. Inactive In this case, the status refers to whether the user(s) listed in the report are currently "active" users in Trella CRM. You can look at data for inactive users. |
 |
Once a report is scheduled, its delivery frequency appears in the SCHEDULE REPORT column on the Reporting page.
You can also schedule a report directly from the Reporting page using the Schedule this report option in the ACTIONS column, without opening the report first.
Links to Specific Reports
Navigate directly to the detailed page for each report.
- AE Events Summary
- More to come