Article Overview
The Overview page in Trella CRM displays the most important and up to date referral metrics relevant to each user. This article shows and describes features that can appear on the Overview page.
Depending on your role, you will see different elements and features on your Overview page.
- An account executive will see metrics based on their own referrals and their upcoming schedule
- A manager (whether a branch manager, area manager, or region manager) will see far more metrics pertaining to all other CRM users beneath them in your company's territory structure. Those metrics can be viewed in many different ways.
- An account administrator has another view with different possibilities
In general, each user will be able to see what they need to see based on their role. What each user sees is summarized below
![]() Every company can customize the structure of their territories and name their sales regions and user roles differently. The examples in this article show the default structure found in Trella CRM before any customization. If you see something that doesn't align exactly with what you see in Trella CRM, that is probably the result of customization by your company during setup. Please make contact with your customer success manager or Trella Health Support if you have questions.
Every company can customize the structure of their territories and name their sales regions and user roles differently. The examples in this article show the default structure found in Trella CRM before any customization. If you see something that doesn't align exactly with what you see in Trella CRM, that is probably the result of customization by your company during setup. Please make contact with your customer success manager or Trella Health Support if you have questions.
Also, the metrics in the demo account from which the images in this article were taken are "made up" to provide examples. The metrics you will see should be more compelling since they will be real.
 In this article
- Overview page Overview
- Sections in the Overview page
- Overview page for Account Executives
- Overview page for Managers
- Overview page for Account Admins
Overview page Overview
The following image has a screenshot of what an account executive would see along with a screenshot from an account administrator. Not all differences are shown - the details for each user are included below in the article sections for each user type. Instead, use this image to become familiar with a few key elements.
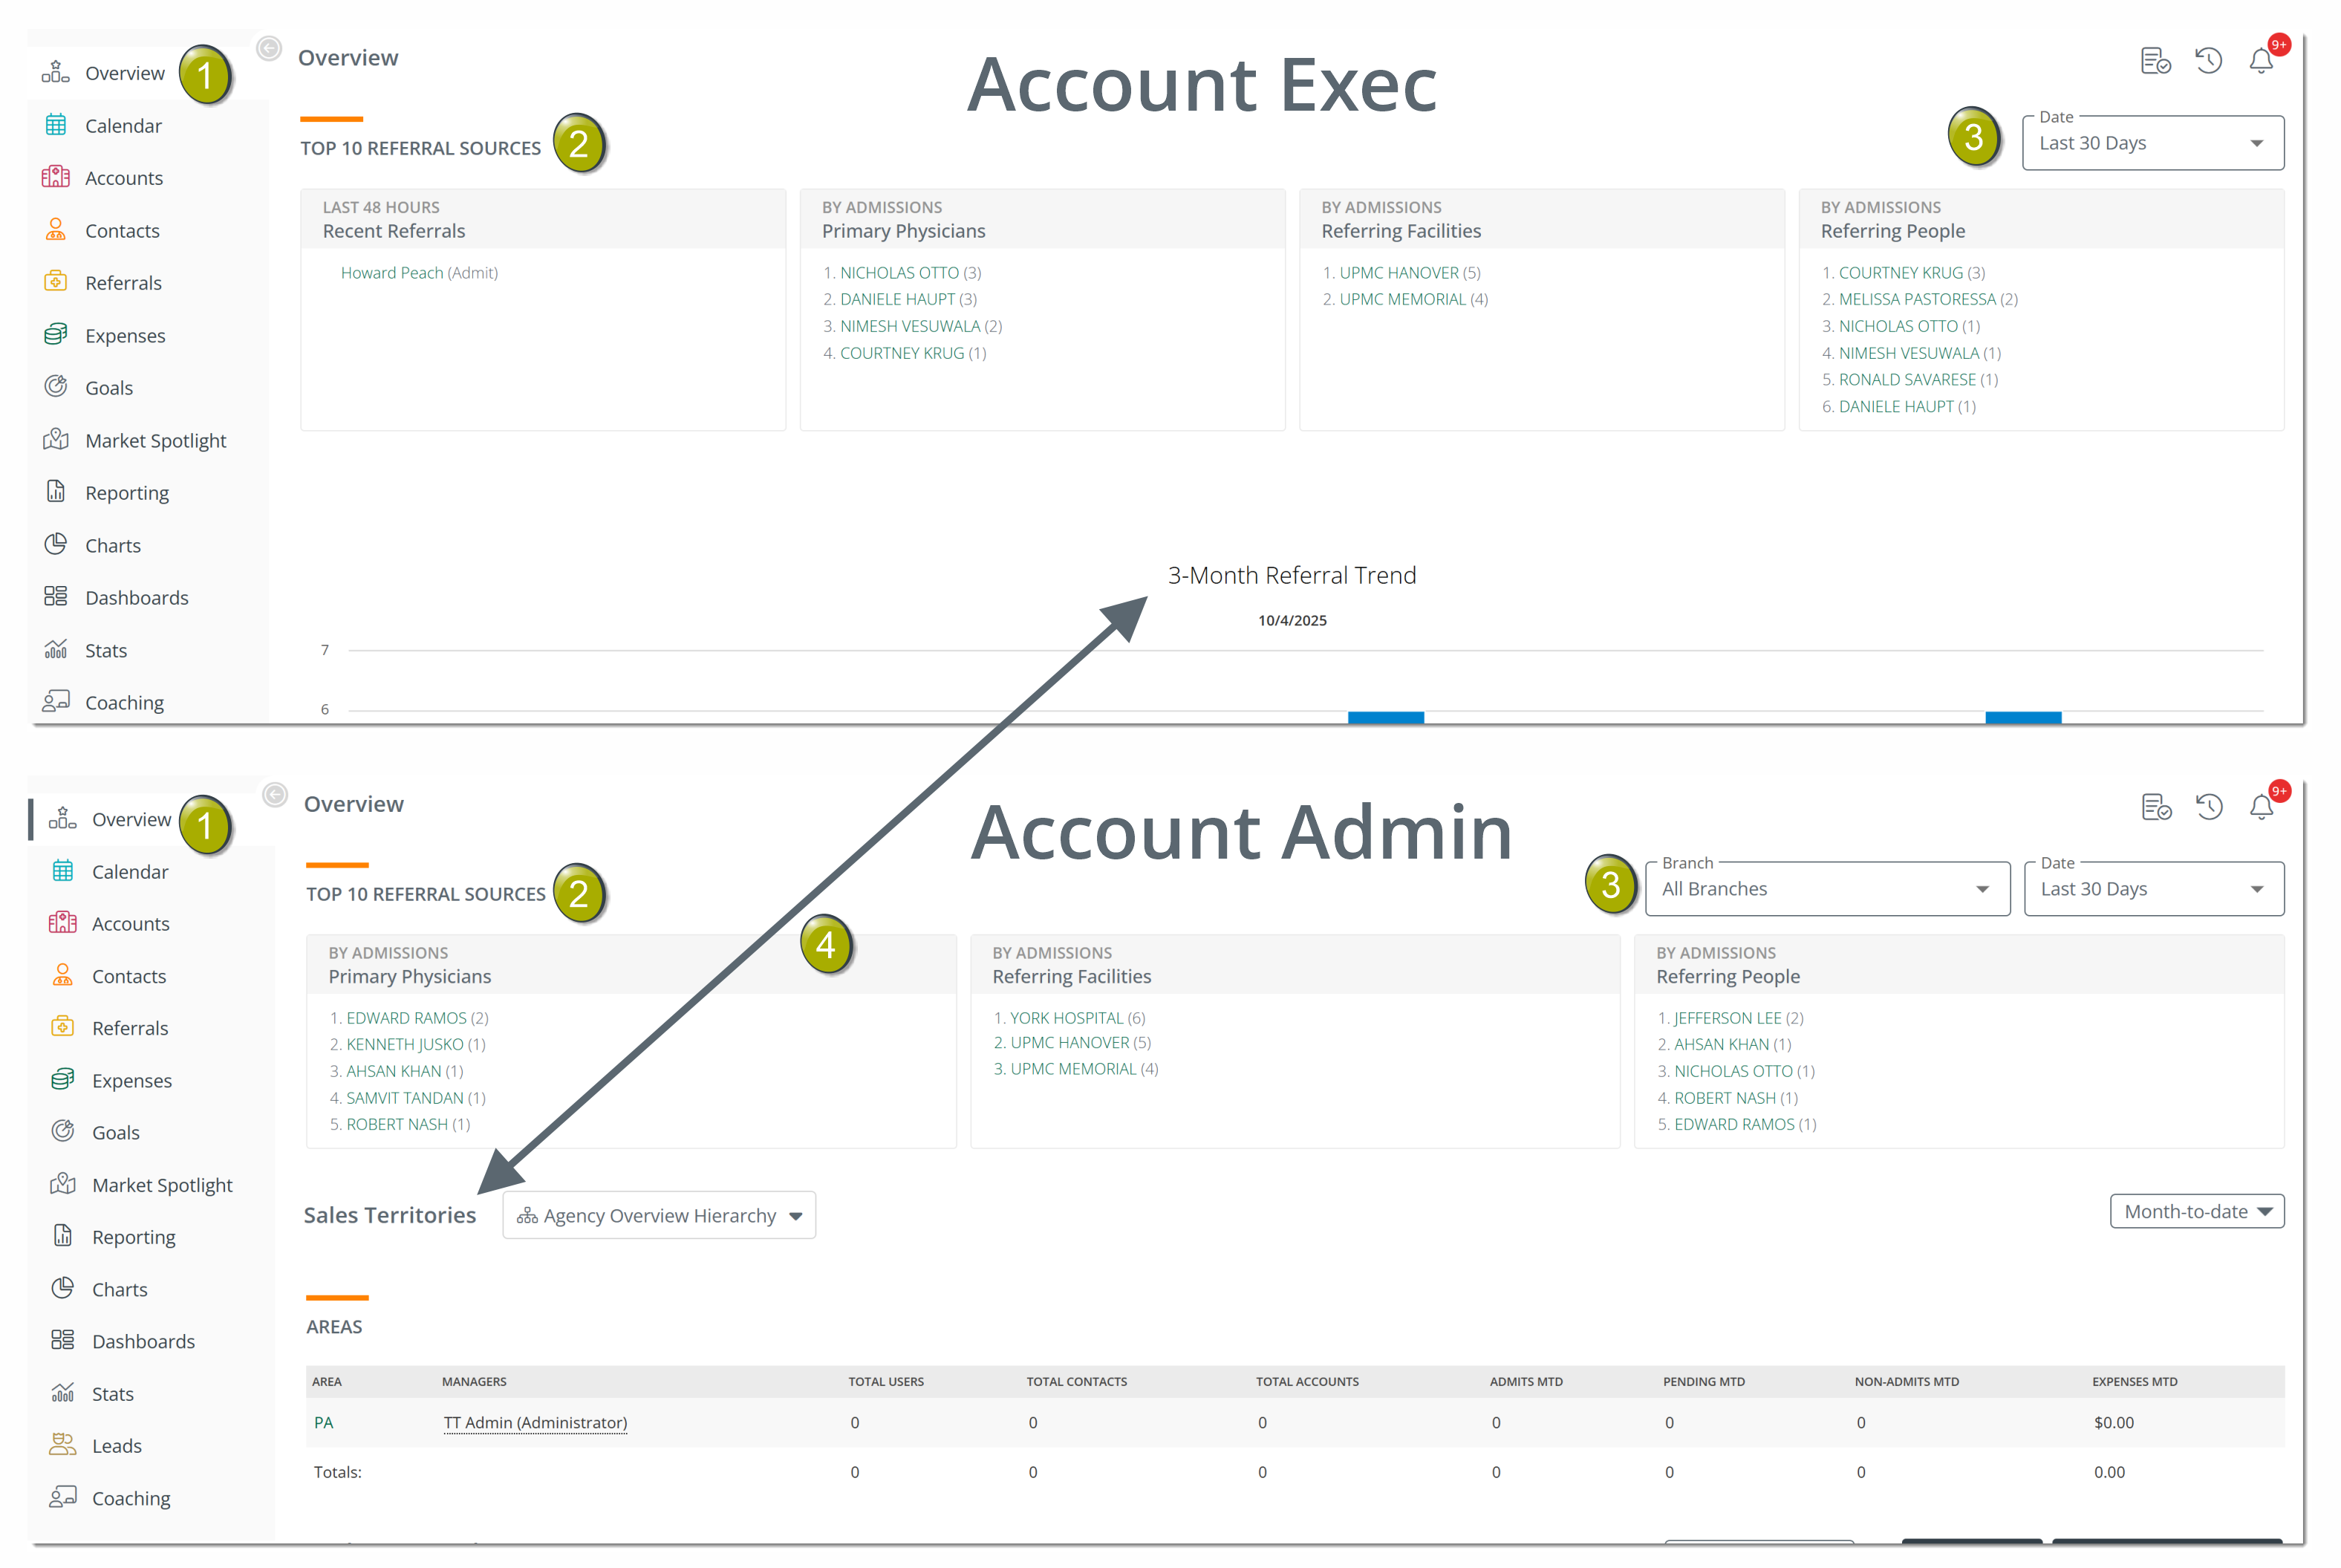
![]() Navigation - Click on the "Overview" button in the left navigation to open the Overview page in Trella CRM.
Navigation - Click on the "Overview" button in the left navigation to open the Overview page in Trella CRM.
![]() Top 10 Referral Sources - This section is universal to Overview pages for all user types. An account executive will only see their own referrals. An account administrator will be able to see all referrals for all users, and a manager will be able to see all referrals for their reps.
Top 10 Referral Sources - This section is universal to Overview pages for all user types. An account executive will only see their own referrals. An account administrator will be able to see all referrals for all users, and a manager will be able to see all referrals for their reps.
![]() What any user sees will depend on how your company has set up roles, territories, branches, and management relationships.
What any user sees will depend on how your company has set up roles, territories, branches, and management relationships.
![]() Filters - The Date and Branch filters allow users to change what is shown in the Top 10 Referral section of the Overview page. The details for these filters can be found below.
Filters - The Date and Branch filters allow users to change what is shown in the Top 10 Referral section of the Overview page. The details for these filters can be found below.
![]() An account executive will not see the "Branch" filter.
An account executive will not see the "Branch" filter.
![]() The Rest of the Page - After the Top 10 Referral Sources section, each different user type will see different sections.
The Rest of the Page - After the Top 10 Referral Sources section, each different user type will see different sections.
Sections in the Overview page
There are five different sections that can show up on the Overview page.
The first section in the Overview page is "Top 10 Referral Sources."
Top 10 Referral Sources
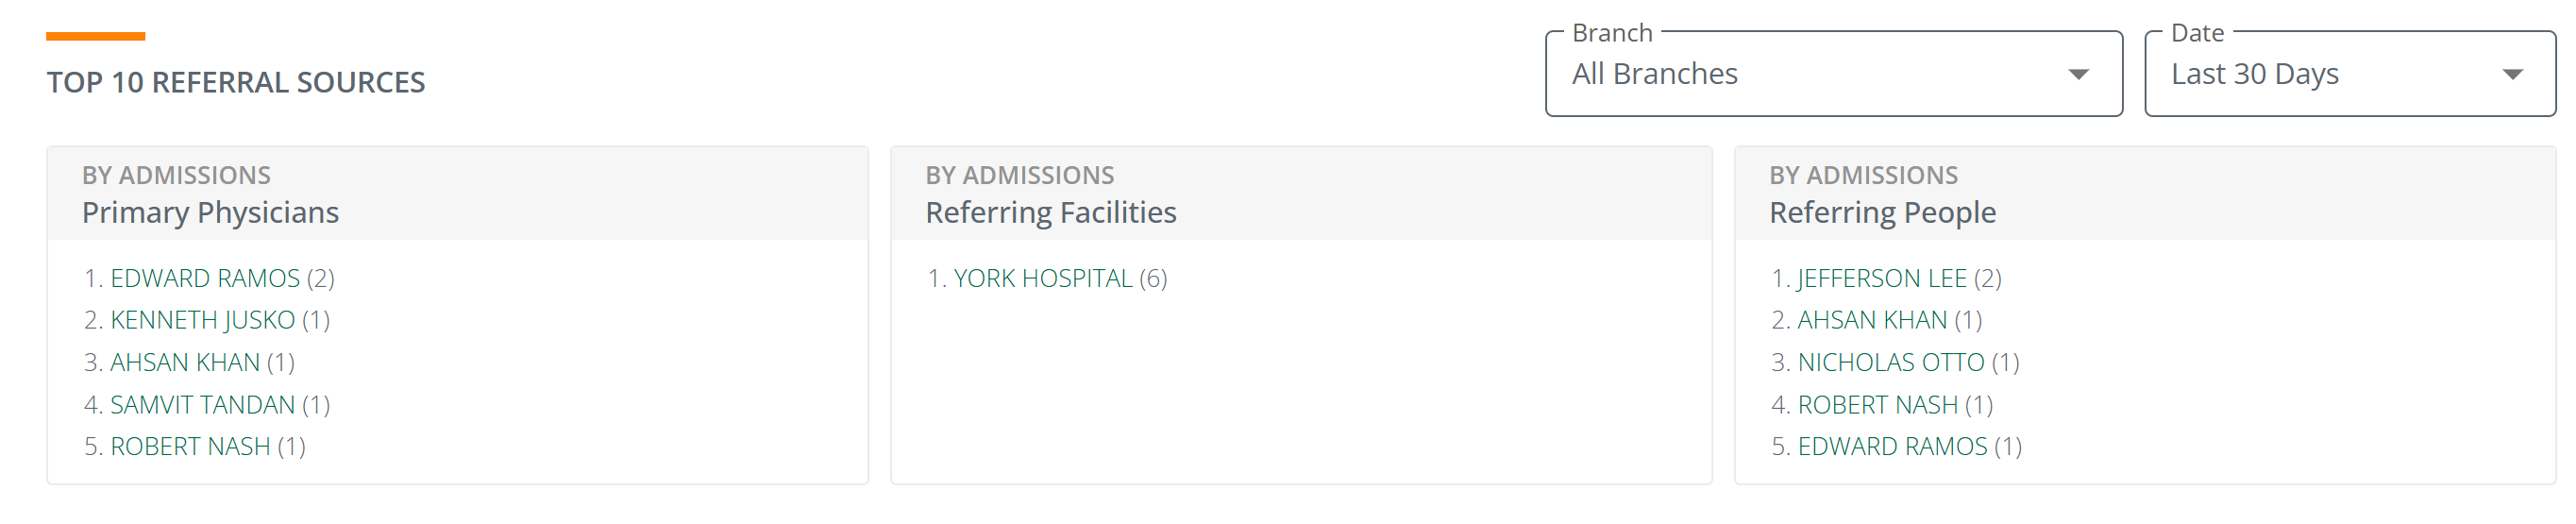
![]() The referral counts on your page are drawn from the metrics in your EHR and reflect what has been imported into Trella CRM.
The referral counts on your page are drawn from the metrics in your EHR and reflect what has been imported into Trella CRM.
Tile Definitions
By Admissions - Primary Physician
The listed physicians are the people qualified to order post-acute care who signed for the care associated with the counted admission.
By Admissions - Referring Facility
The office or facility that referred the patients counted in the admission to post-acute care.
By Admissions - Referring People
The listed people are those who connect the referral to a specific post-acute agency.
![]() For the details on these three references, see The Importance of the Primary Referring Person.
For the details on these three references, see The Importance of the Primary Referring Person.
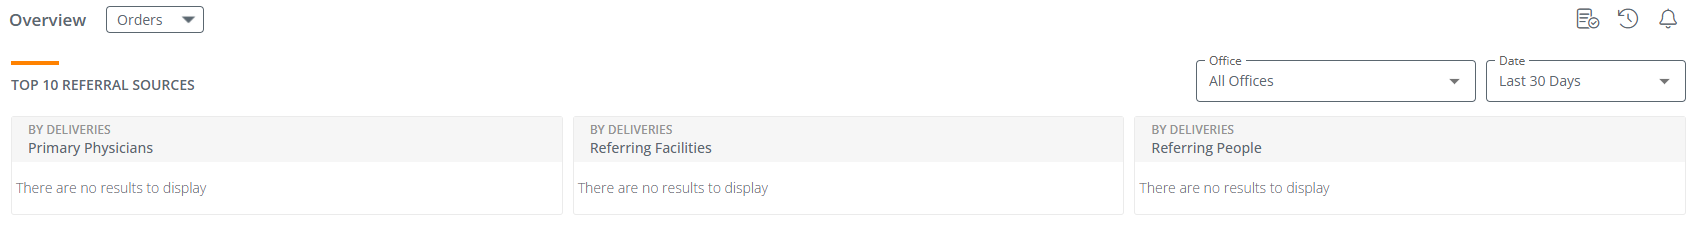
Trella CRM for Suppliers
If you have a supplier role, you are not looking for admissions. Your Top 10 Referral sources will say "By Deliveries" instead of "By Admissions." The tiles will still show the top 10 referral sources. The filters will work the same way.
Filters
The filters allow you to change the parameters that determine which admissions are shown in the Top 10 Referral Sources section of the Overview page.
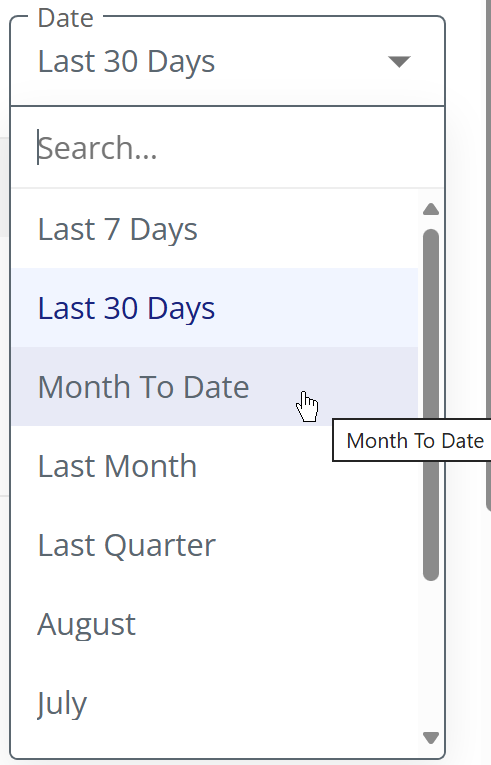
Date Filter
|
The date filter allows you to set the time period for the admissions shown in the Top 10 Referral Sources section.
|
 |
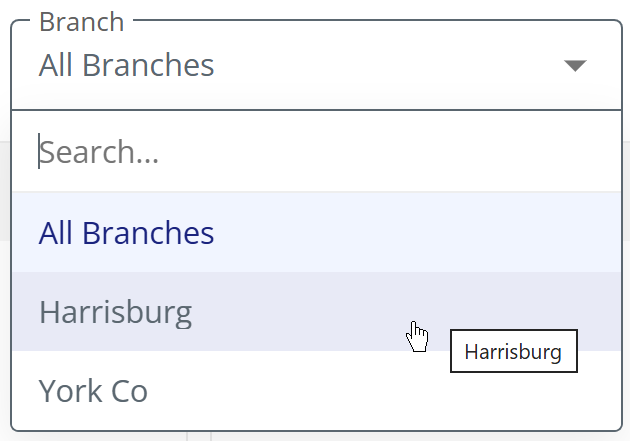
Branch Filter
|
The branch filter is available to users who have access to different branches and who need to be able to focus on referral sources and counts to specific branches.
For suppliers, this filter will appear as offices, not branches |
 |
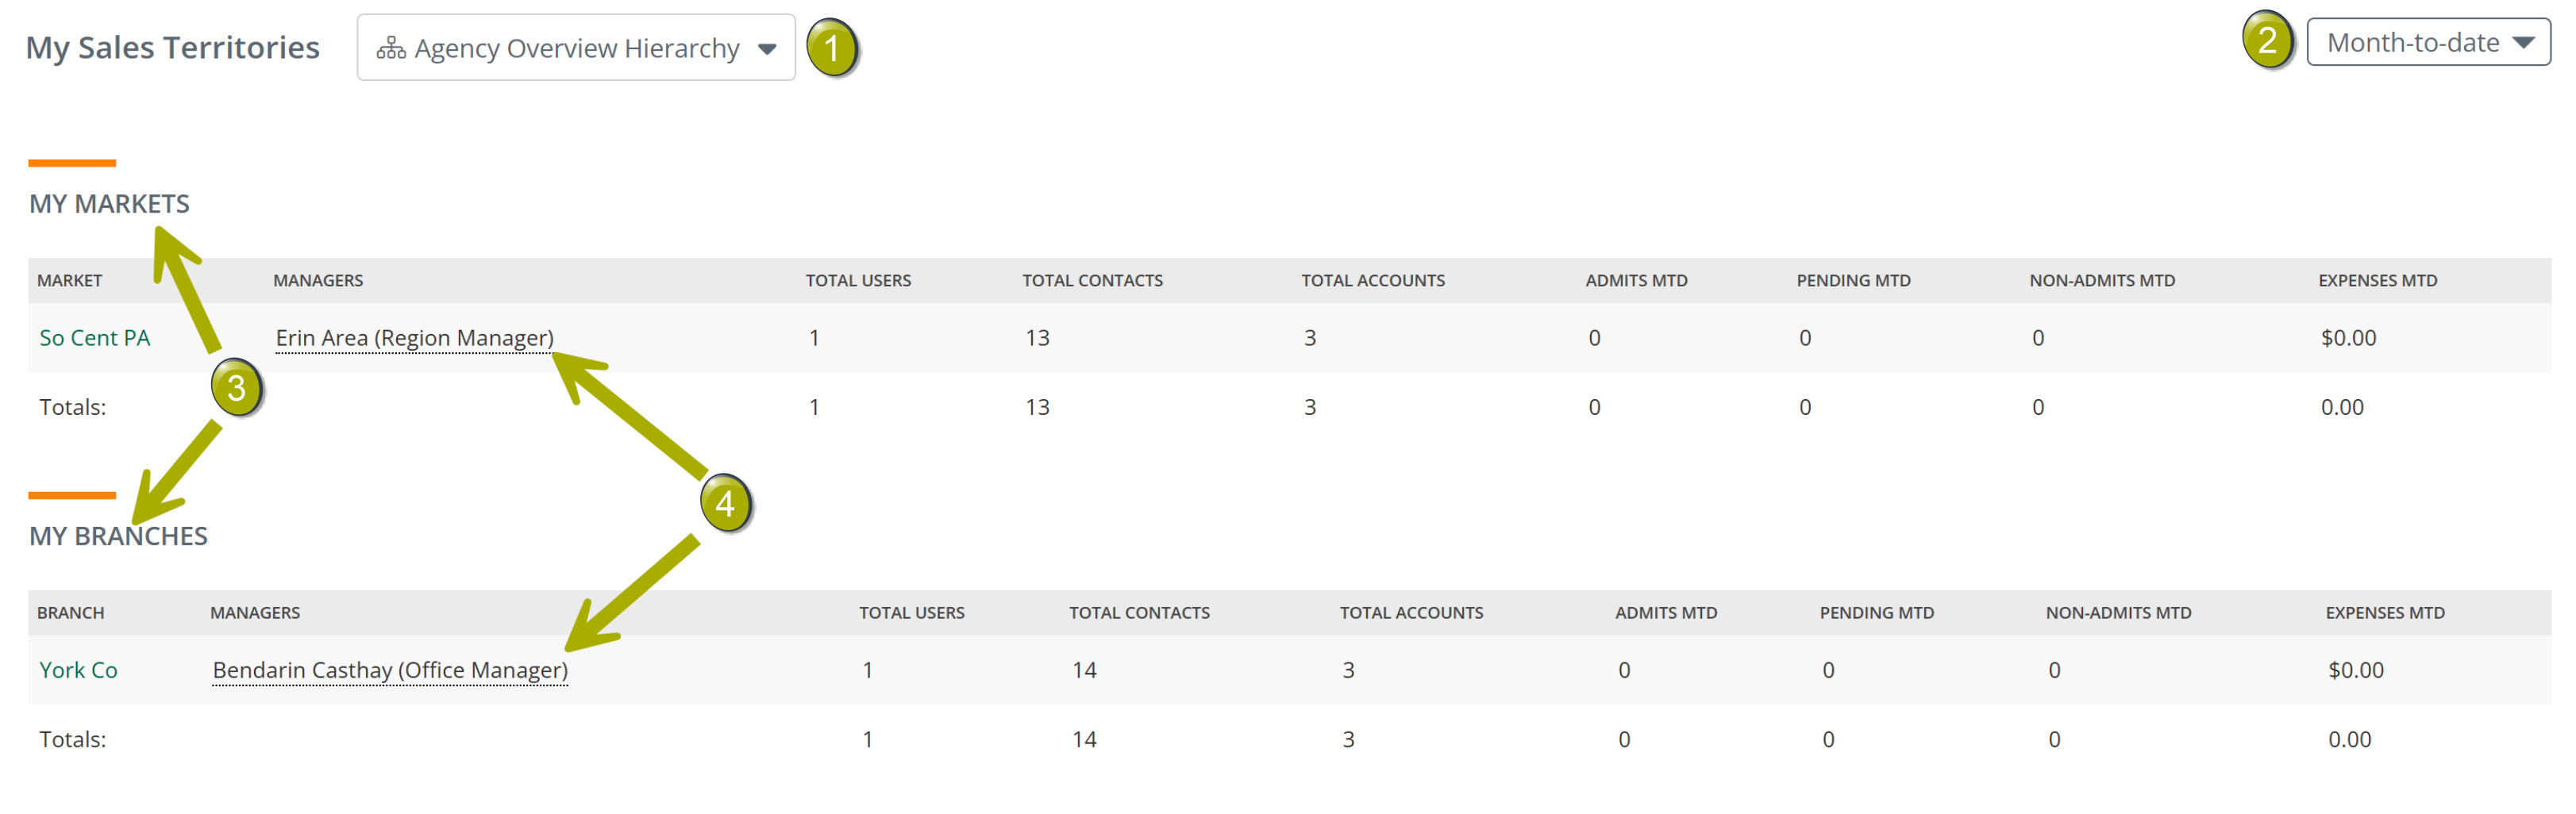
Sales Territories/My Sales Territories
The following image is from a demo user set up as a manager, so it will almost absolutely be far simpler than what you will see. Use the image to familiarize yourself with the features.
|
|
 |
|
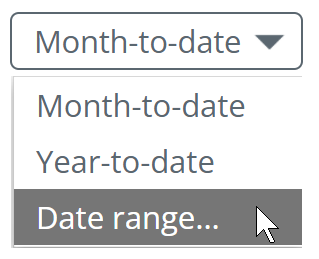
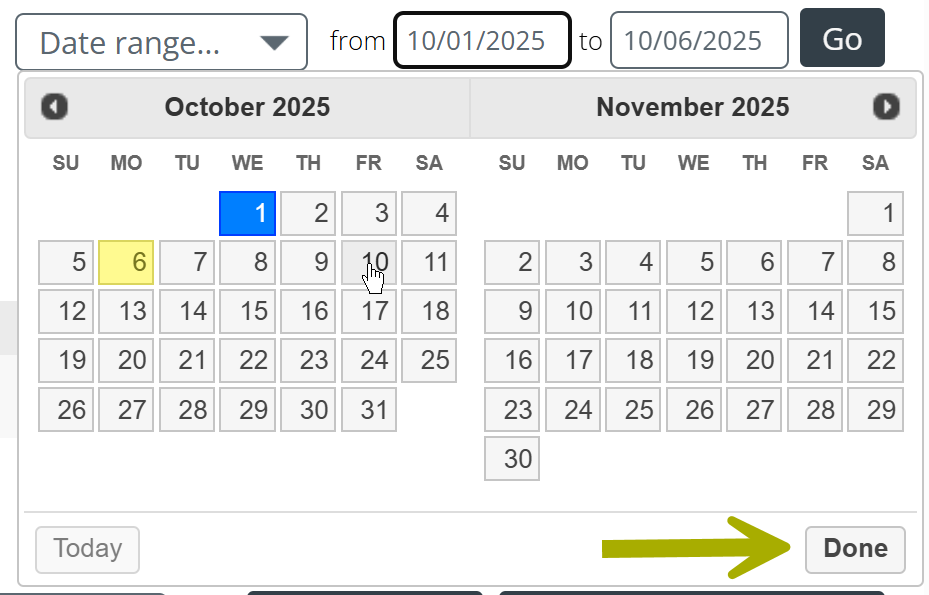
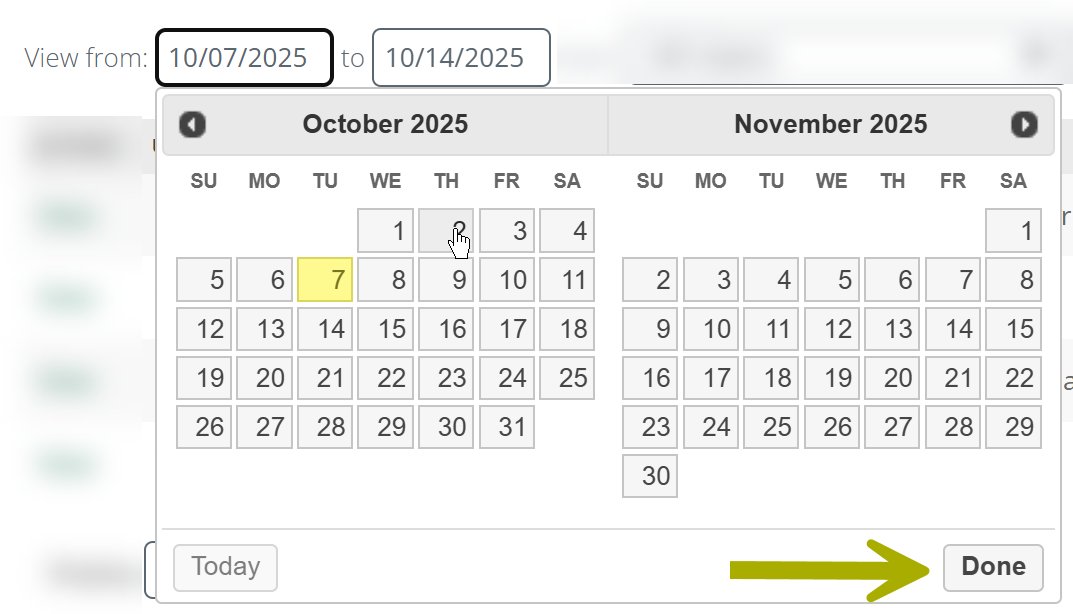
If you click on the "Date range..." option, the calendar interface shown below will open. The current date is shown in yellow. Select a range and click on the "Go" button at the top right. Click on the "Done" button to close the tool. |
 |
 | |
The metrics in the table will reflect the reporting period that you choose.
![]() Tables - a table will be displayed for each territory level in your company hierarchy. Since the sample user is a regional manager, she can see the South Central PA region and the and the York, PA branch.
Tables - a table will be displayed for each territory level in your company hierarchy. Since the sample user is a regional manager, she can see the South Central PA region and the and the York, PA branch.
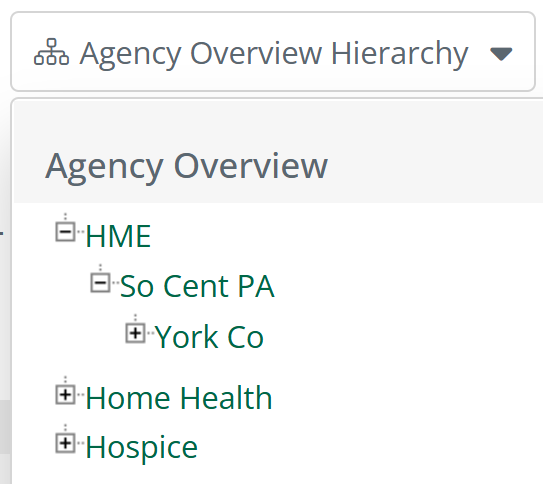
![]() The structure of our demo company is simple. It is highly likely that you will see multiple regions and multiple branches (and potentially more "layers" of territories in your territory structure.) Either way, what you will see will be determined by the territory structure your company uses and the specific role you have been assigned.
The structure of our demo company is simple. It is highly likely that you will see multiple regions and multiple branches (and potentially more "layers" of territories in your territory structure.) Either way, what you will see will be determined by the territory structure your company uses and the specific role you have been assigned.
![]() Users shown in the tables - The user shown in each row is the referral owner for the referrals counted in the same row as determined by the data from the EHR. This is a different connection from account or contact ownership.
Users shown in the tables - The user shown in each row is the referral owner for the referrals counted in the same row as determined by the data from the EHR. This is a different connection from account or contact ownership.
Marketer Snapshot
The Marketer Snapshot gives a detailed view of referral trends and counts for a selected user. This feature is limited to managers and account admins in companies that have access to Trella Insights.
How to choose the user
|
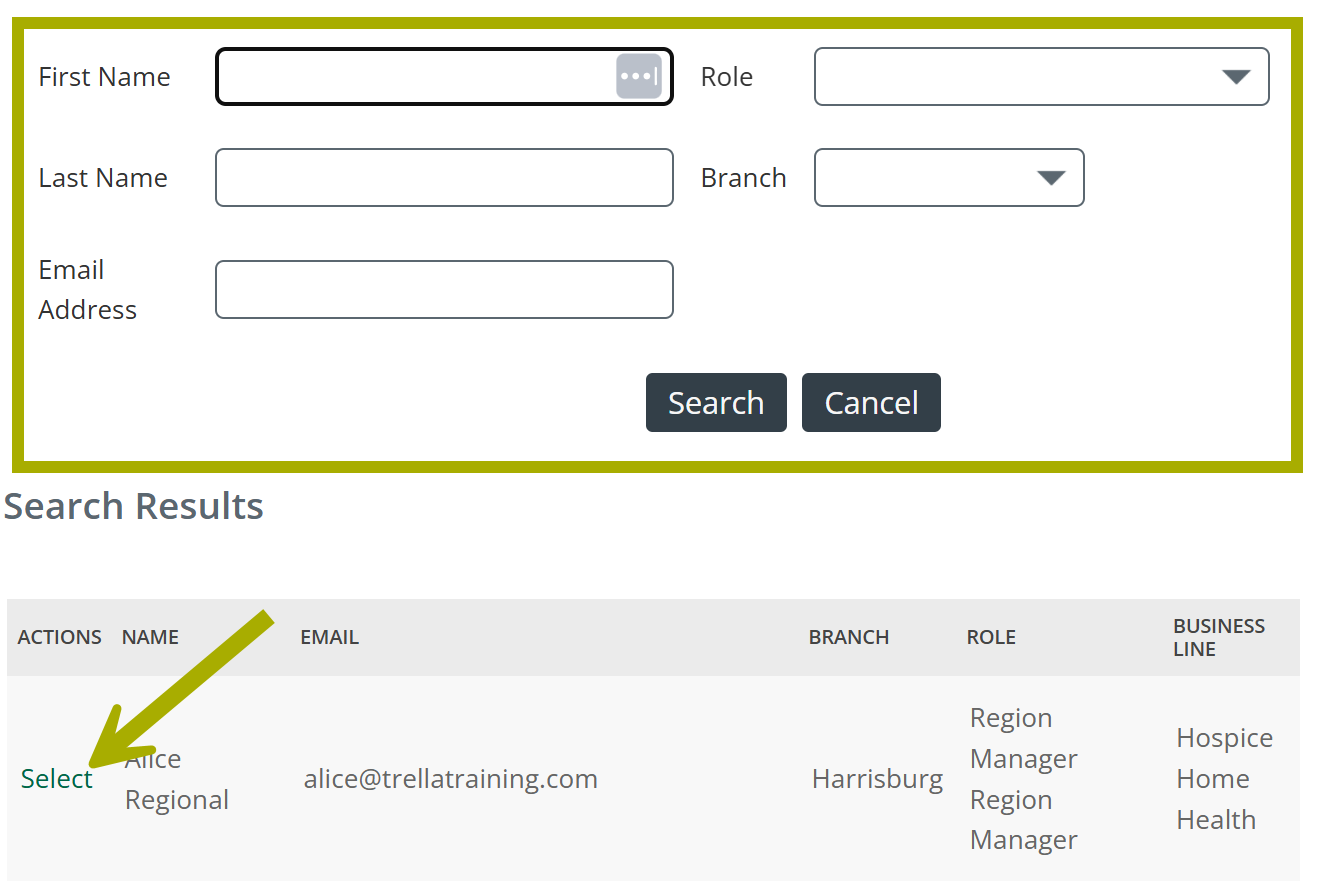
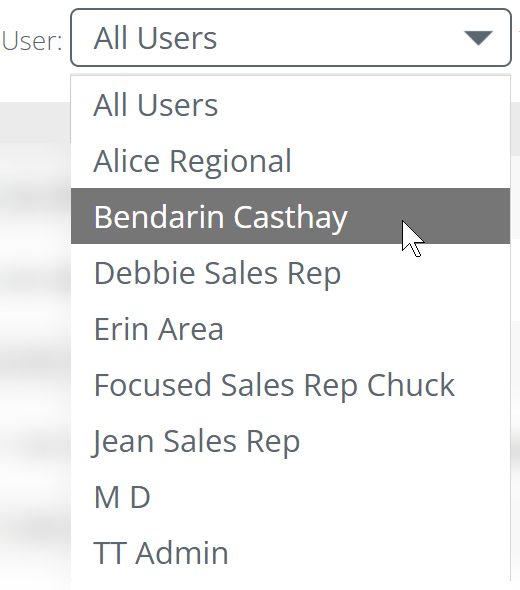
At the top-right of the Marketer Snapshot section is a blank field labeled "Marketer." Click on the field or the magnifying glass to select a specific user from your company. |
 |
|
A dialog box will open that allows you to select a single user.
|
 |
|
For this example, we used the Trella Training admin user. Click on the "Get Snapshot" button to open the Marketer Snapshot for the selected user. |
 |
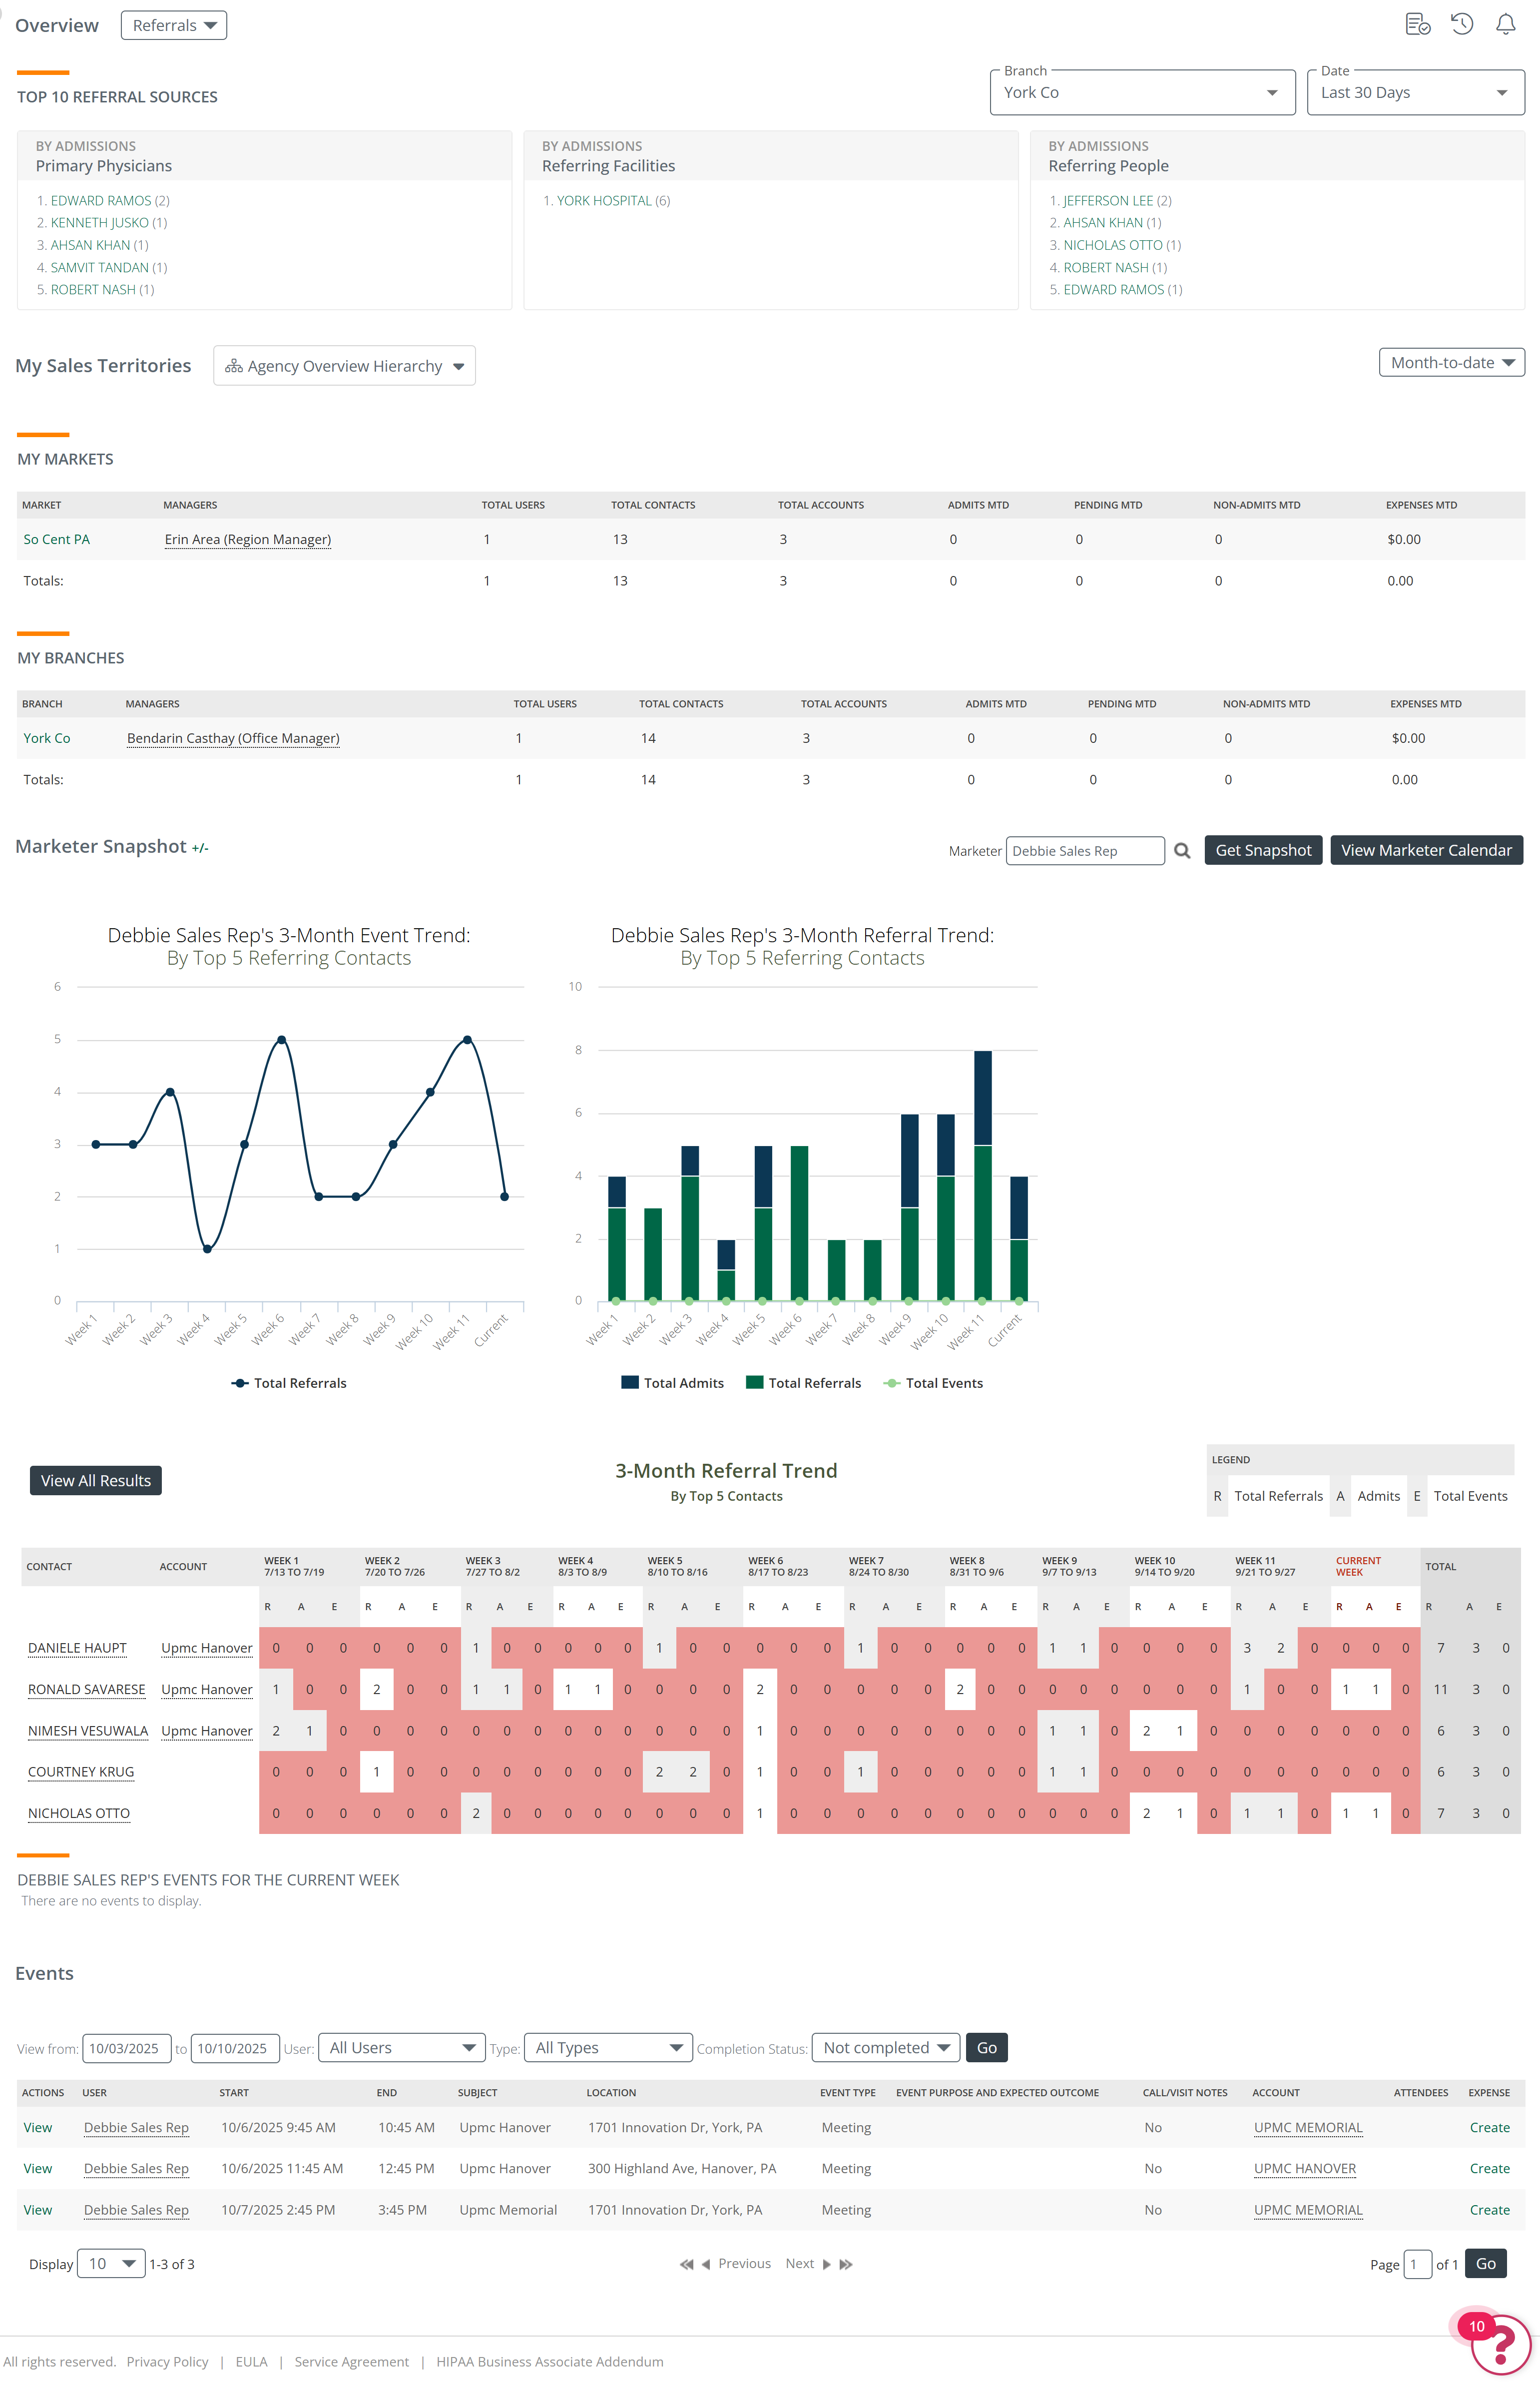
The following image shows the extensive details available in the Marketer Snapshot.
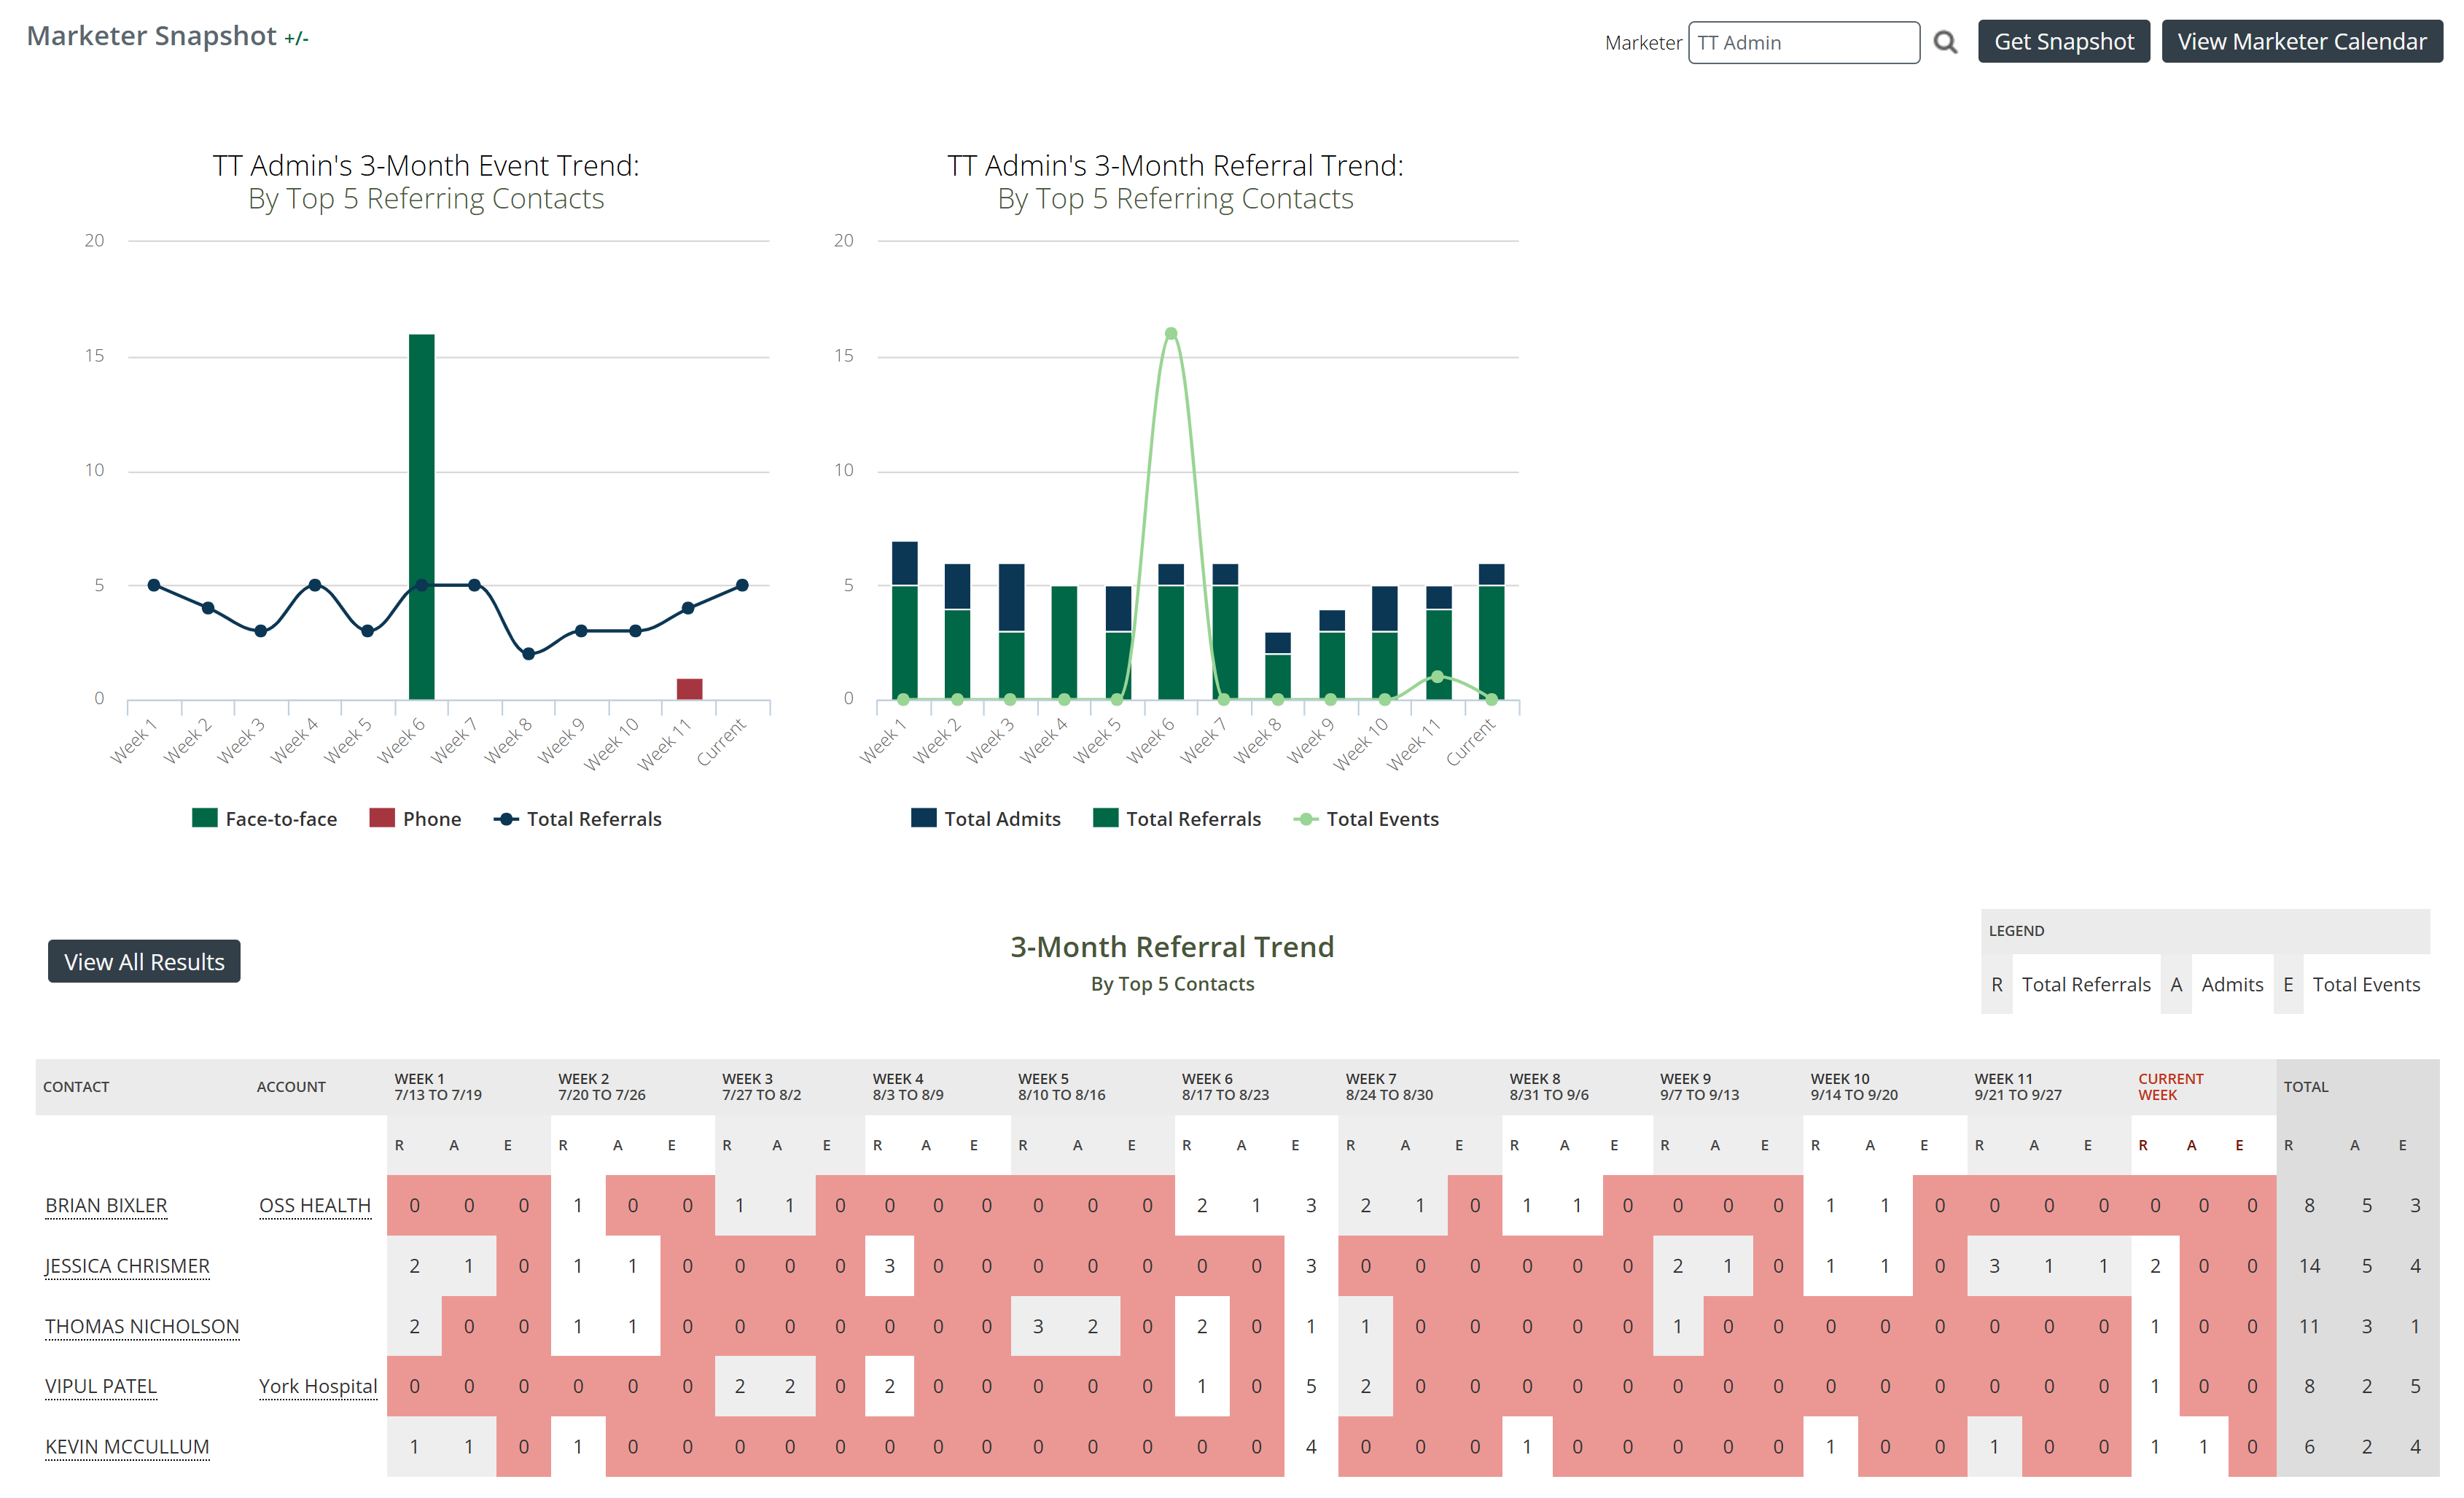
The two charts and the table show data from a three month period broken up into 12 weeks.
![]() Some observations
Some observations
- The top-left chart shows event trends by event type with a line graph of referrals. At a glance, you should be able to see a general connection between the event type and subsequent referrals
- The top-right chart shows a different correlation - admits and referrals (bars) to the count of events
- Finally, the table at the bottom shows the counts of referrals, admissions, and events week by week over the three month period for the listed contacts. It is easy to see patterns and overall performance for the selected user.
| If you click on the "View Marketer Calendar" Trella CRM navigates to the Calendar page for the selected user. |  |
![]() Keep in mind that the images in this article are drawn from a sample demo account where there are no actual users making visits. If this were real life, it would prove that TT Admin has no events in his calendar, and we would hafta wonder how he is getting any of those admits and referrals.
Keep in mind that the images in this article are drawn from a sample demo account where there are no actual users making visits. If this were real life, it would prove that TT Admin has no events in his calendar, and we would hafta wonder how he is getting any of those admits and referrals.
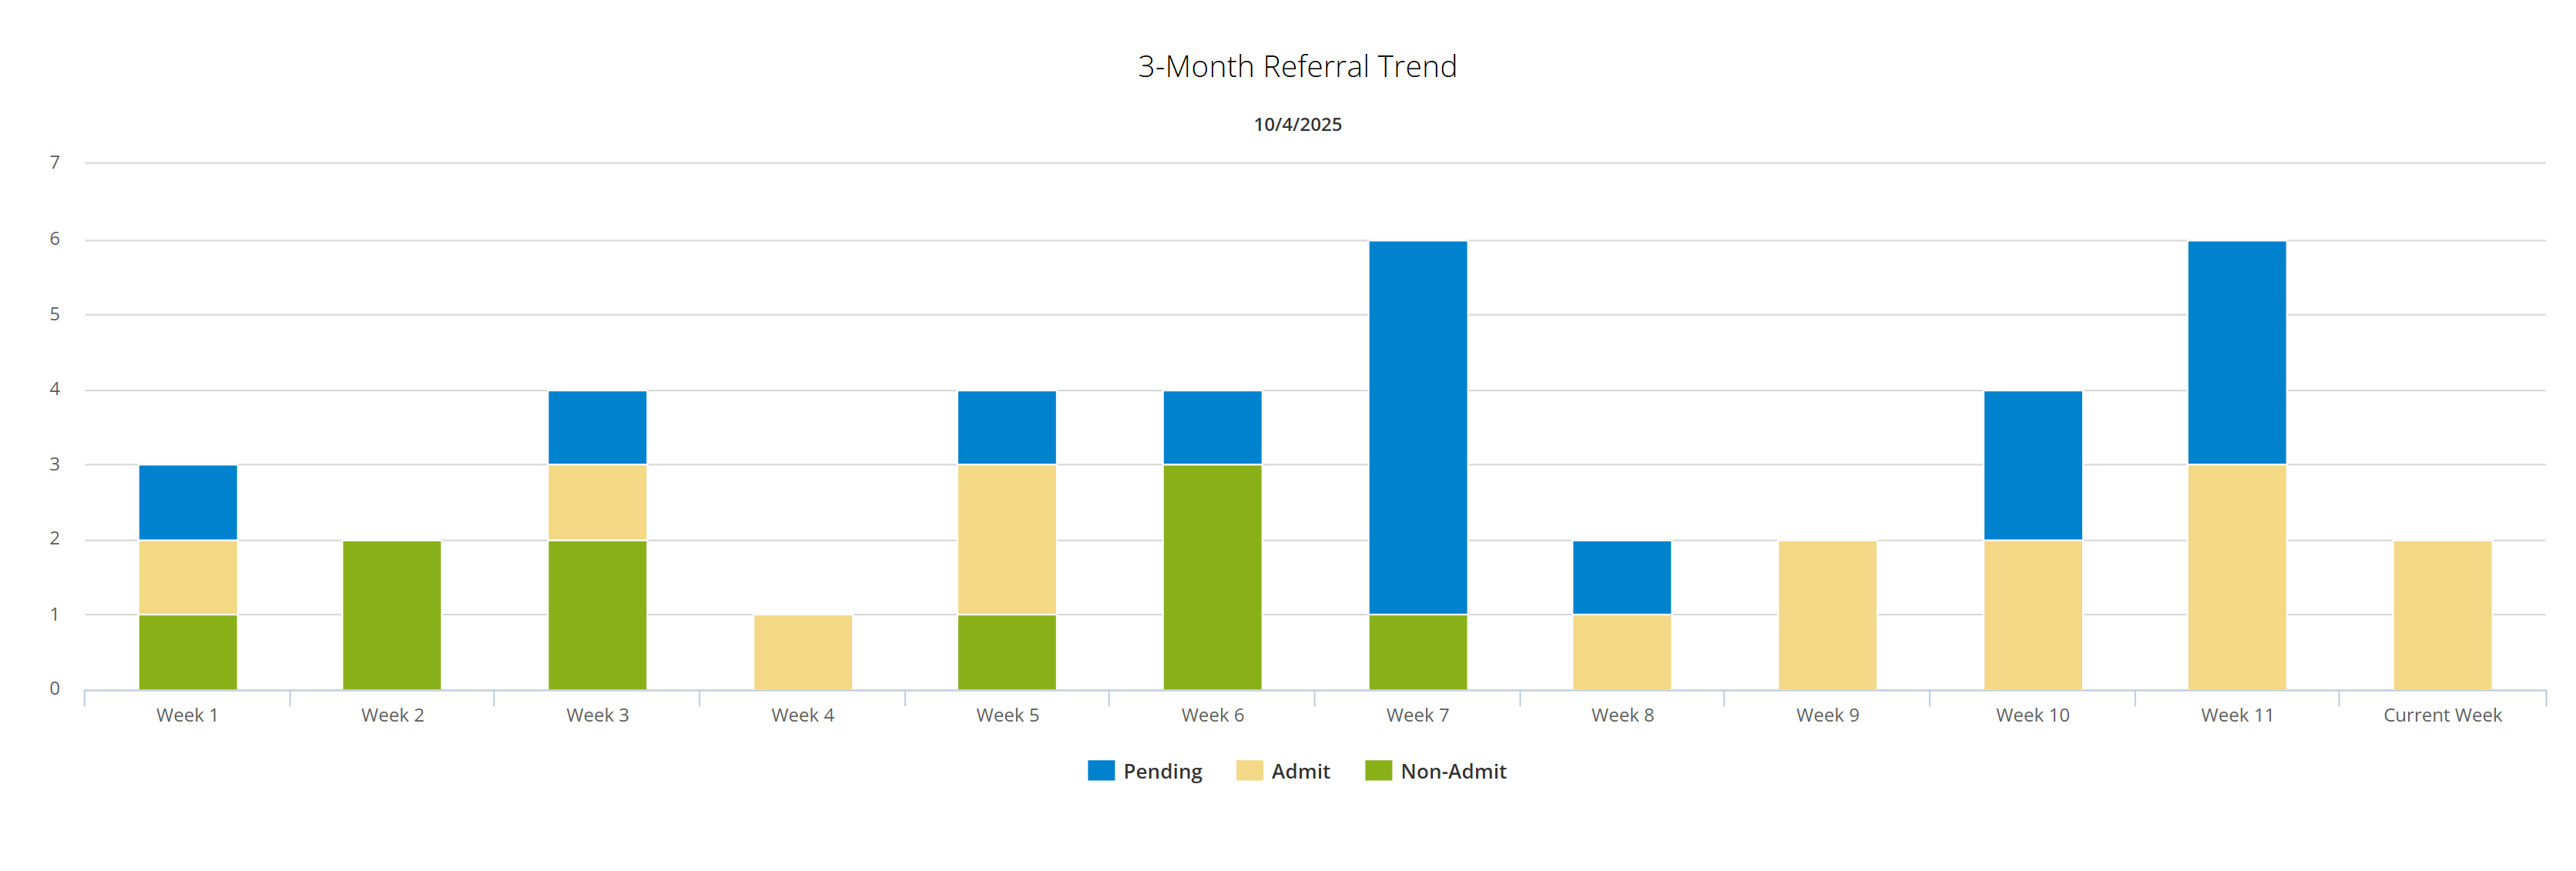
3-Month Referral Trends
The 3-Month Referral Trends chart shows counts of referrals broken out by week and by referral type: pending, admit(ted), and non-admit.
![]() For a thorough and detailed view of the different referral types, see Step 5 - Viewing Referrals - Basics.
For a thorough and detailed view of the different referral types, see Step 5 - Viewing Referrals - Basics.
| Hover - If you hover your mouse over a colored section of a single bar in the chart, the count for that section is shown. | 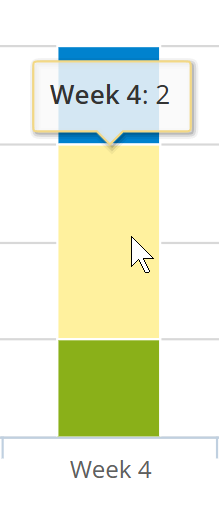 |
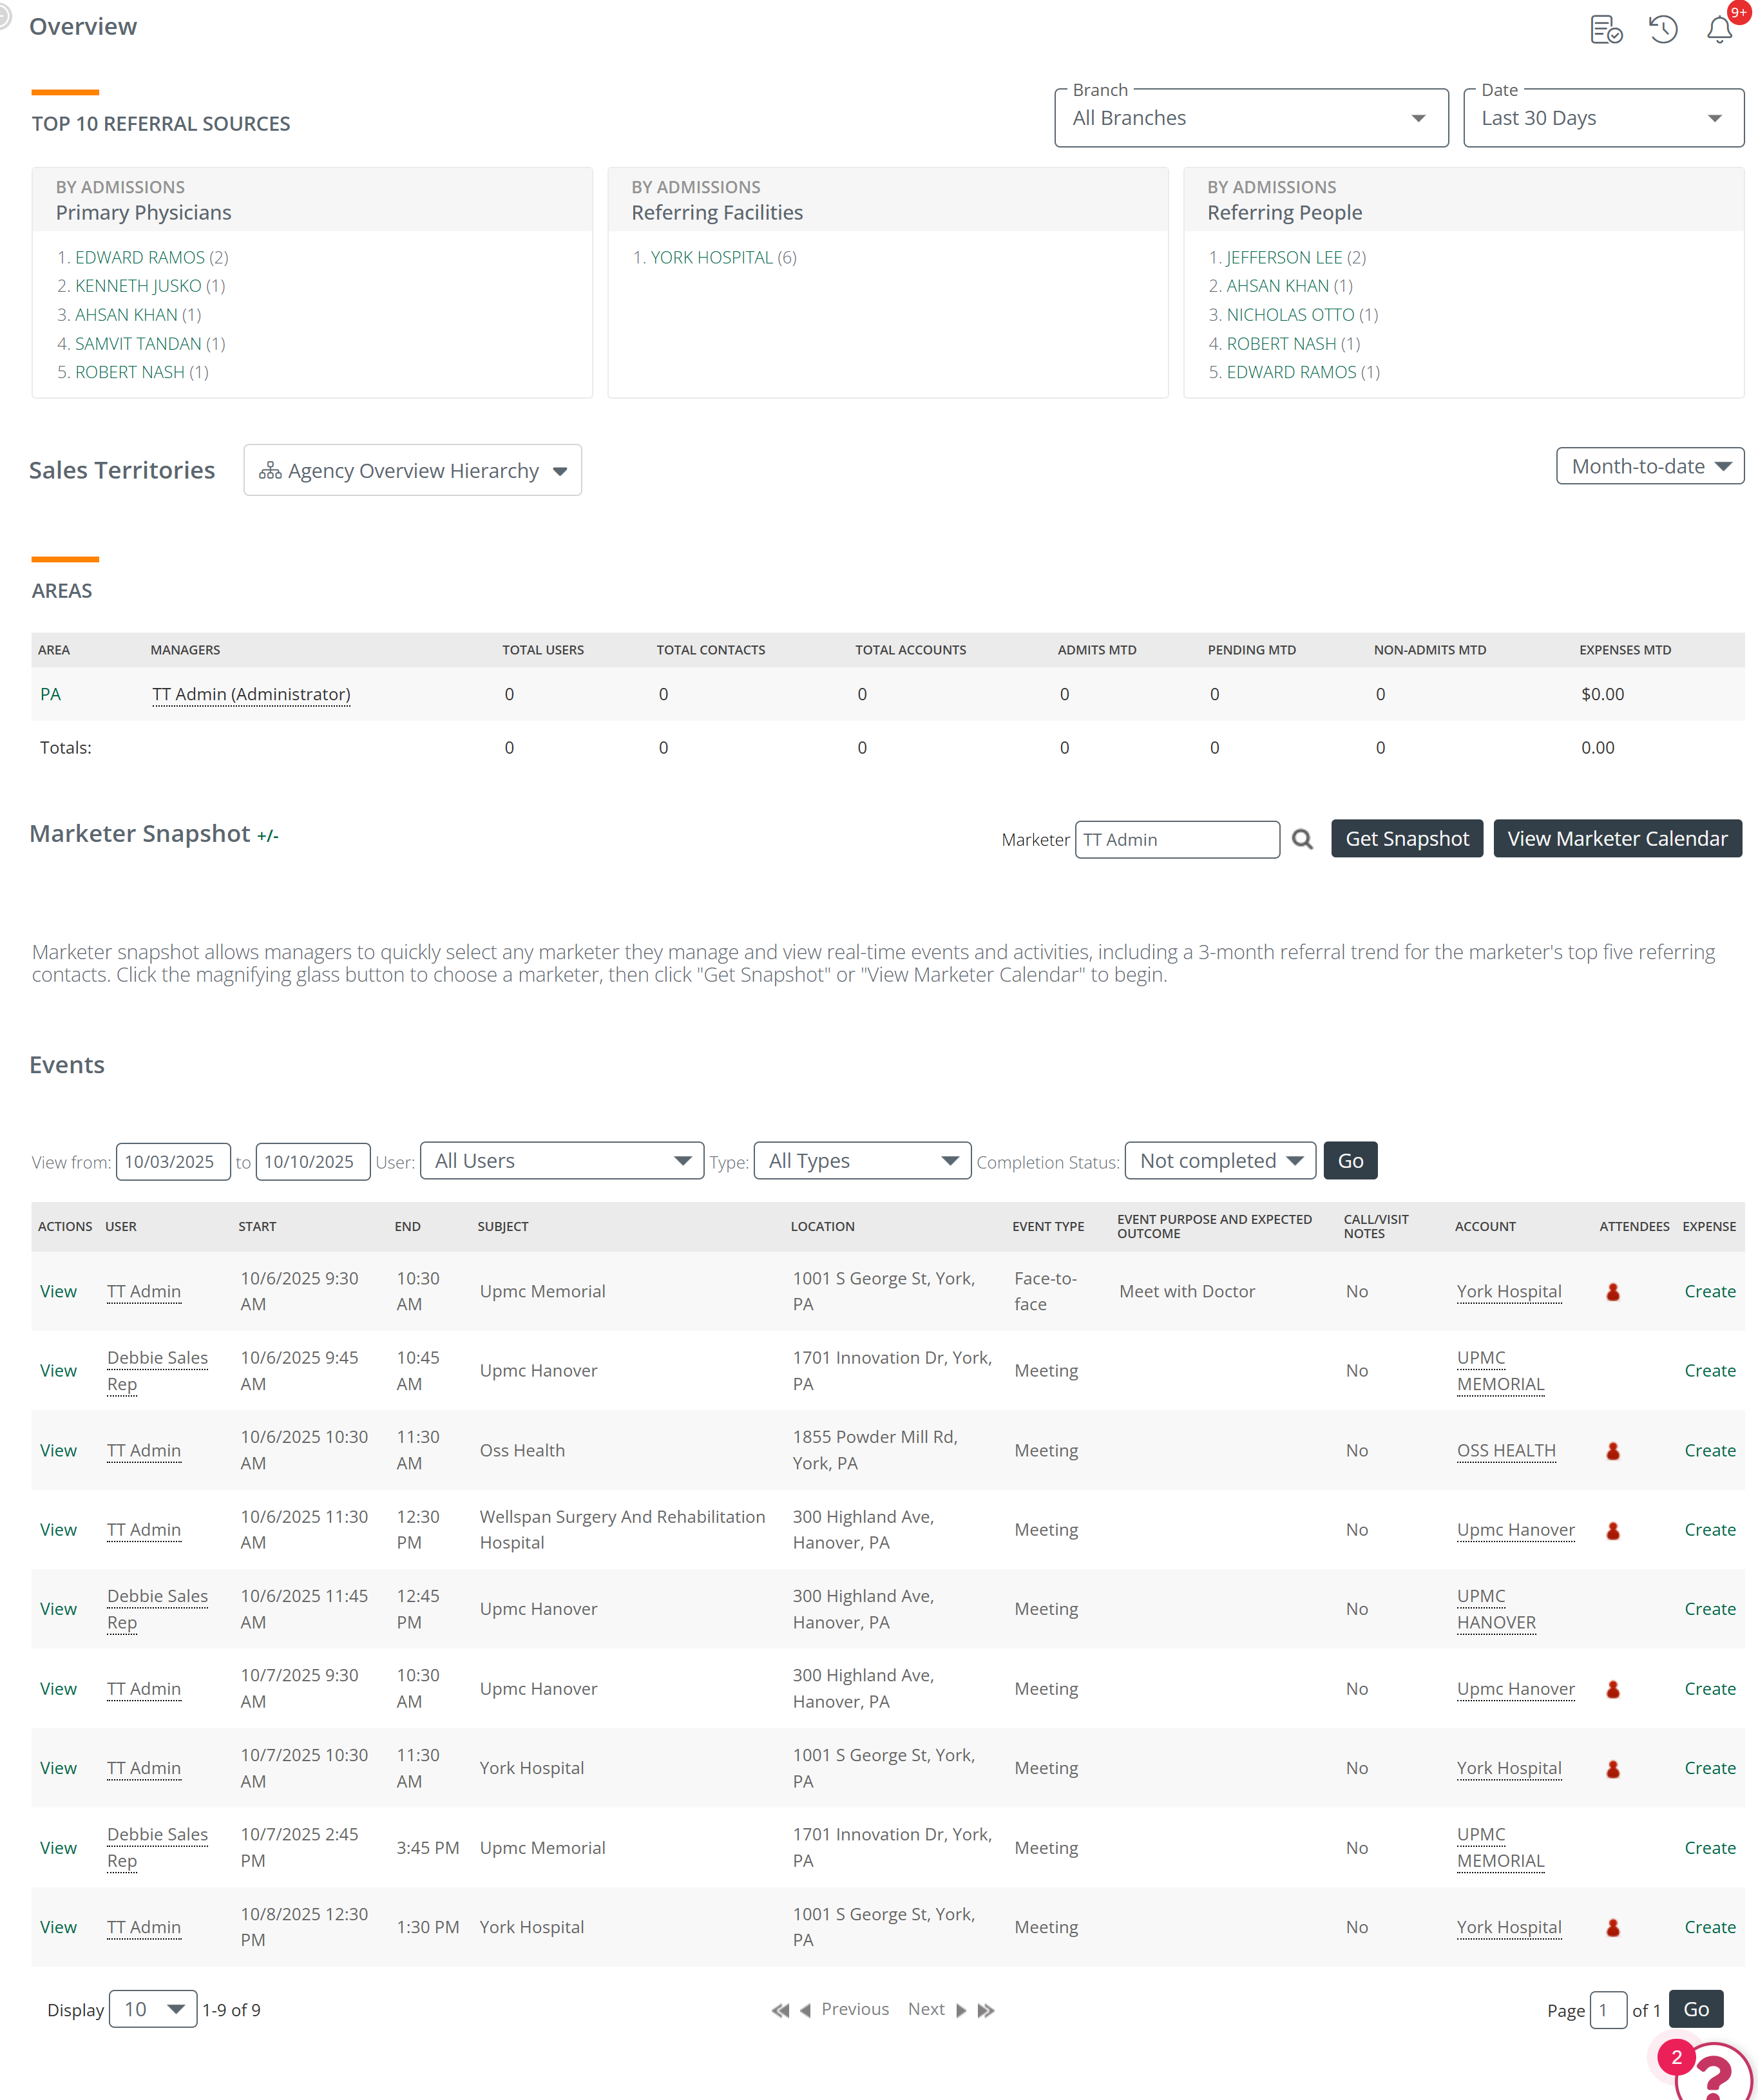
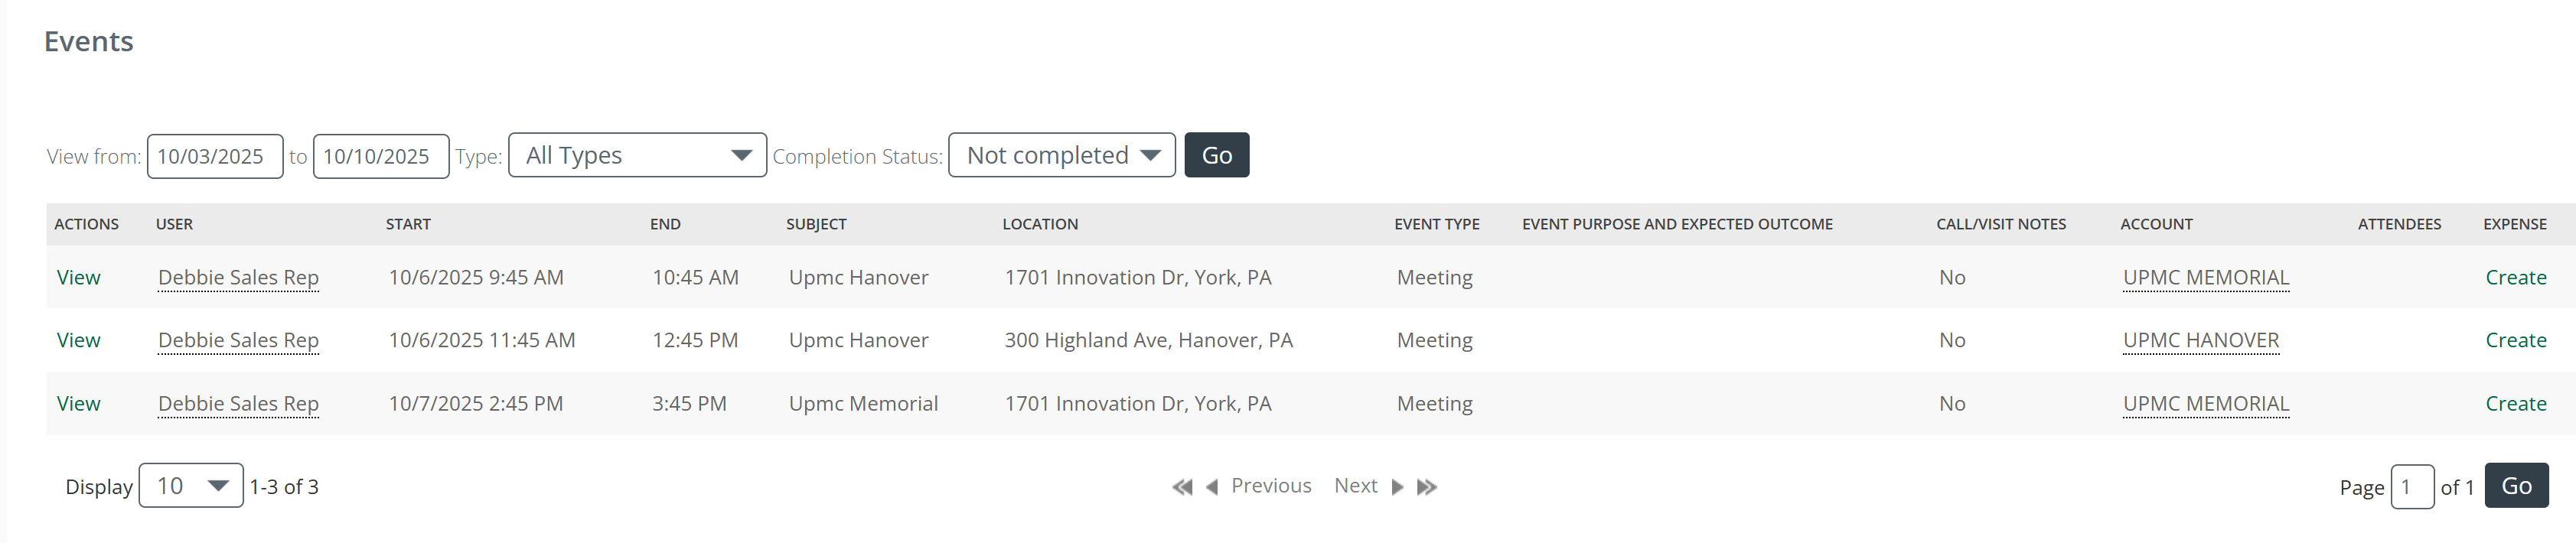
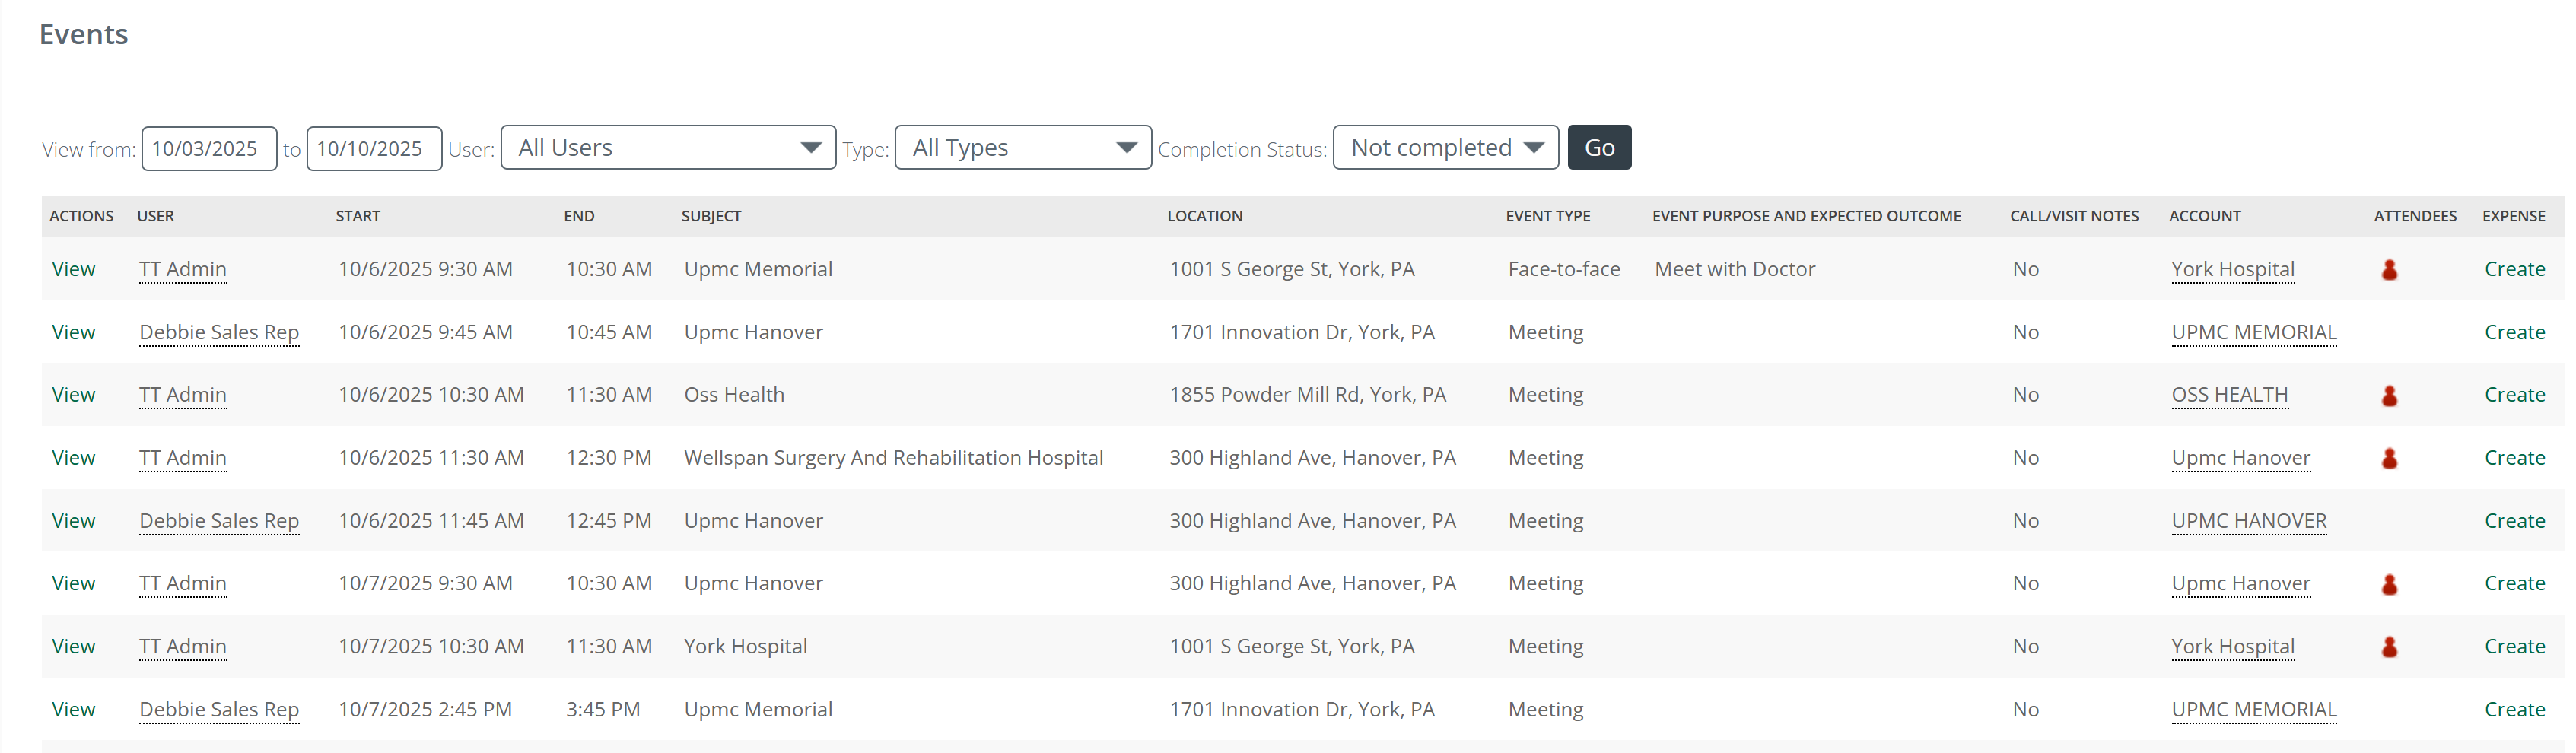
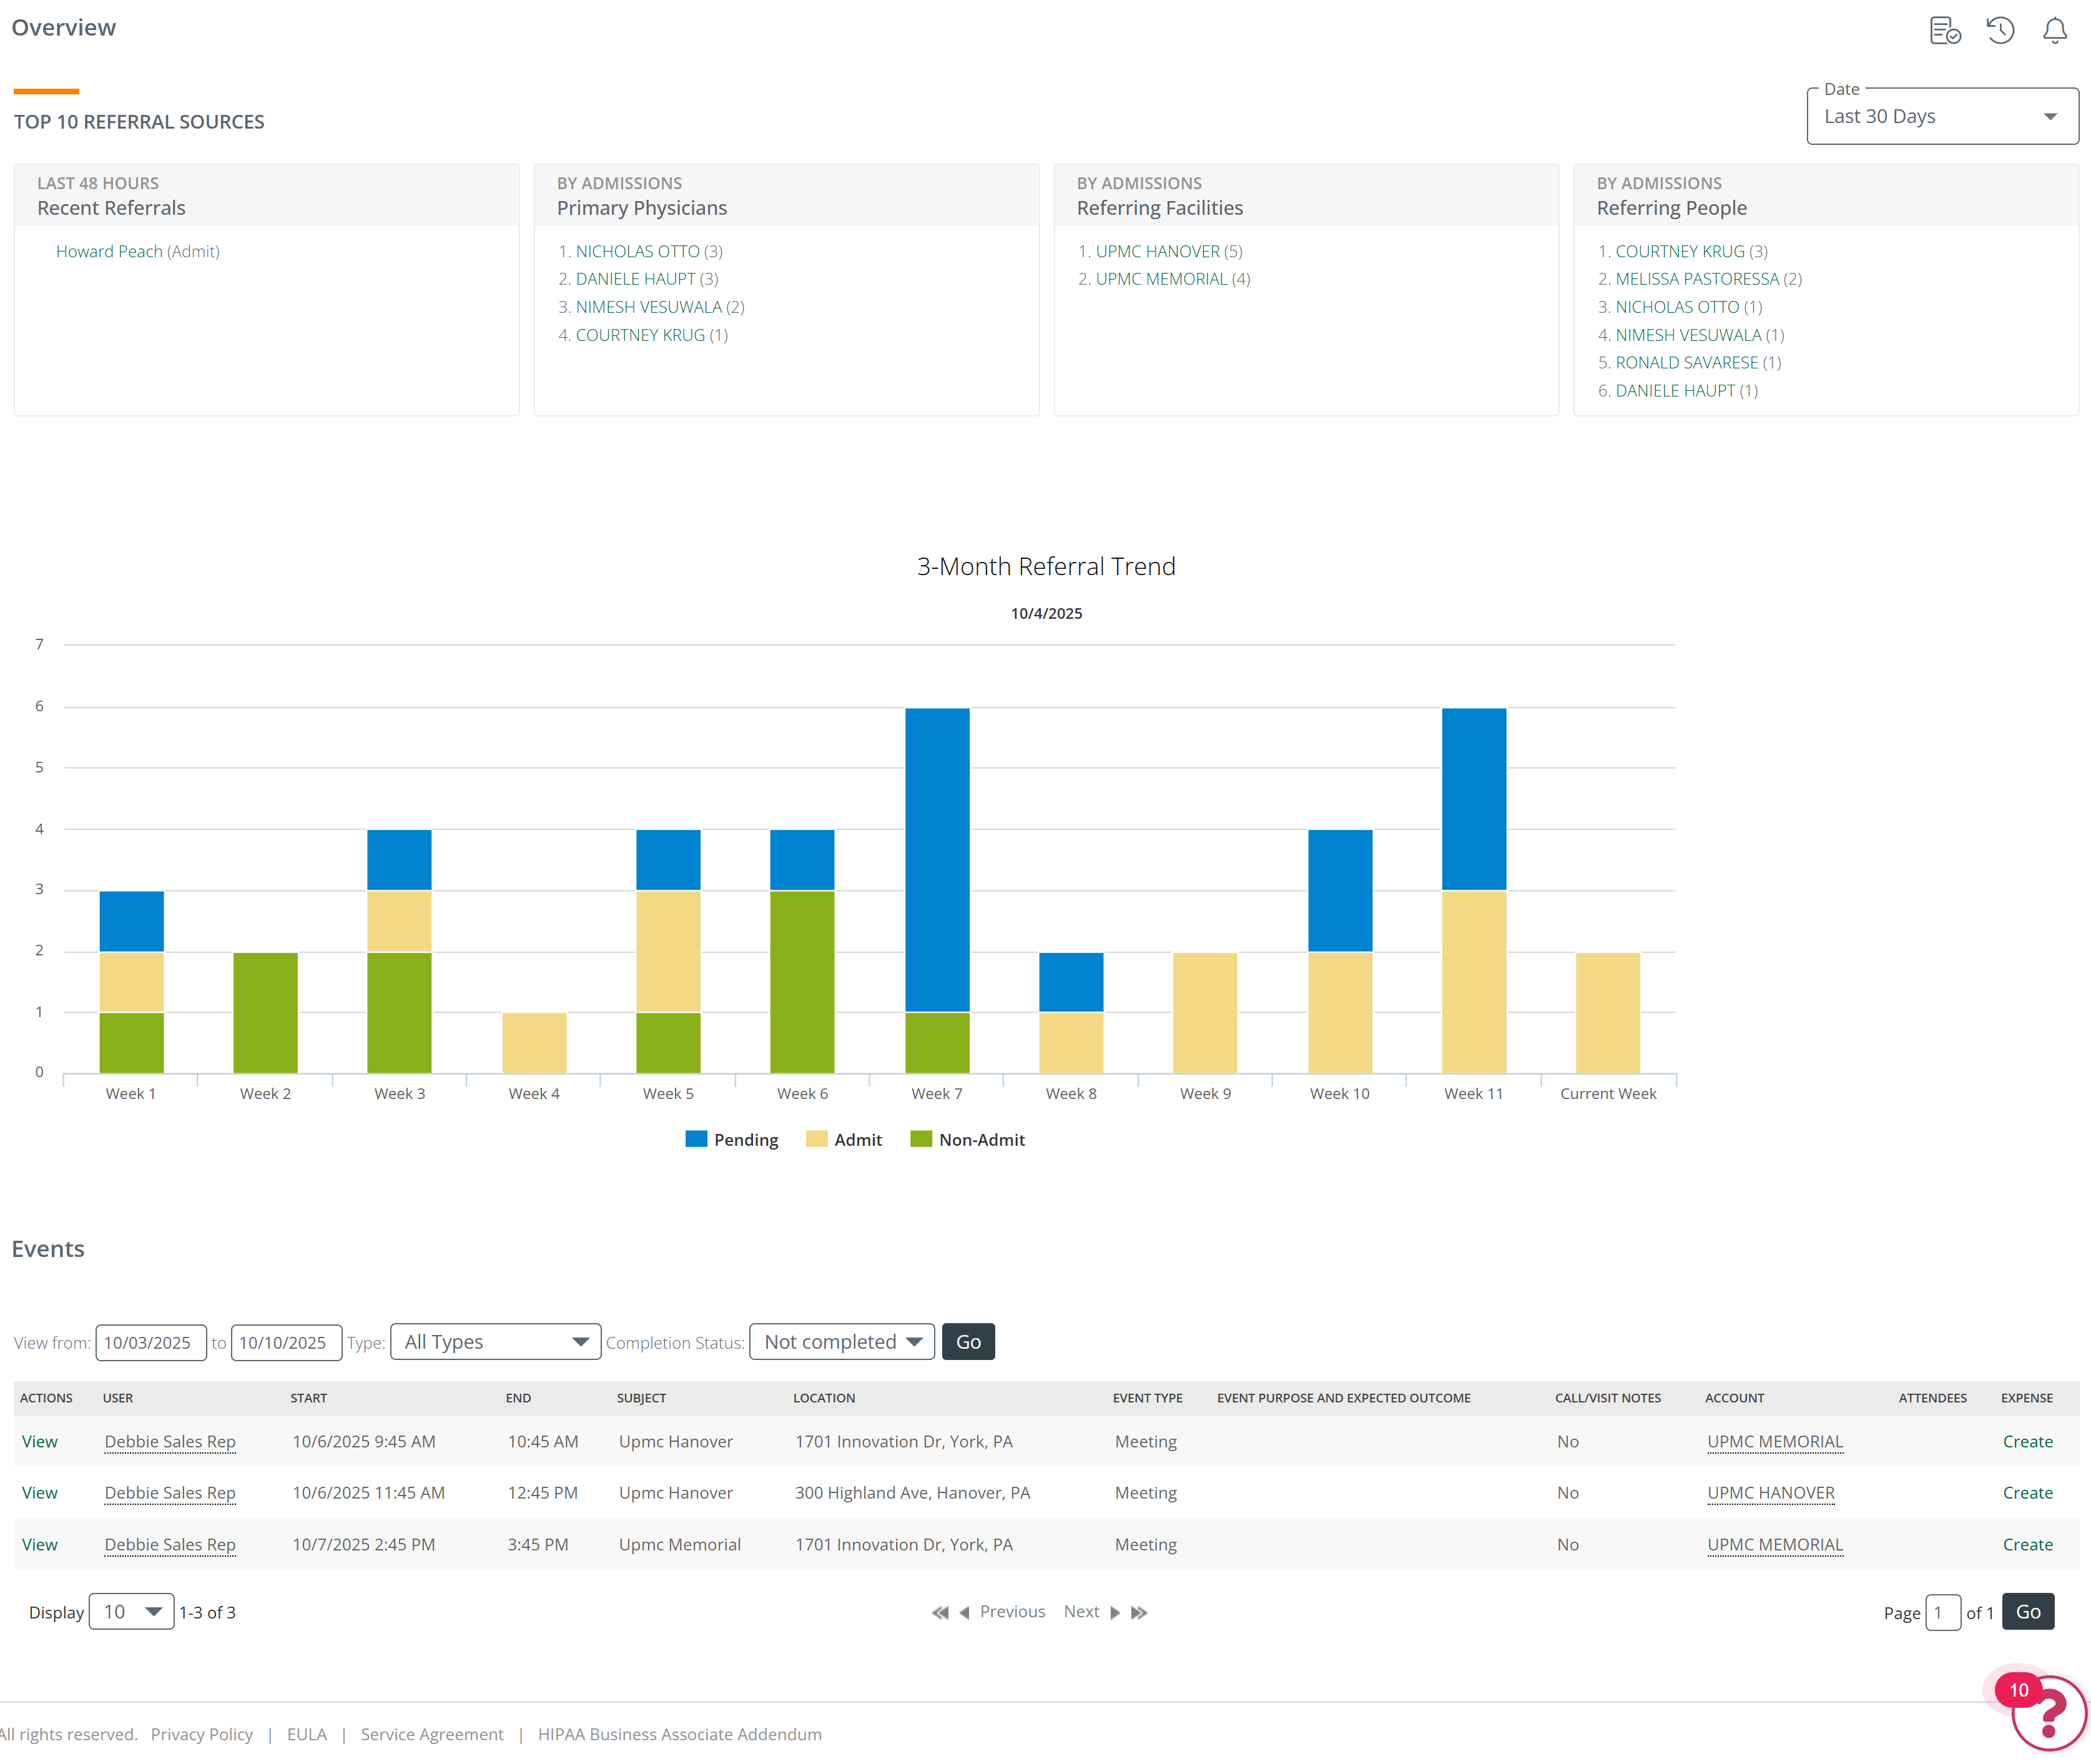
Events
The Events section is a convenient addition to the Overview page. The table shows a summary of events from the user or users calendar.
![]() A couple details
A couple details
- Which users you will see in the table will depend on your assigned role. All users will see their own events. The top image below is for Debbie, and account executive. The lower image is from an account administrator
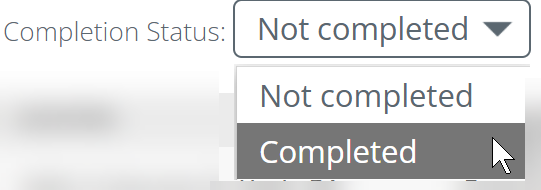
- The filters (see usage content below) allow you to change what is shown in the table.
Filters
Account Executive’s Overview
The Overview page provides an at-a-glance view of a marketer’s top referral sources, 3-month referral trends, and their events.
 Value
Value
- At a glance, you can identify high-volume referral sources
- Allows you to quickly confirm the accuracy of your contact ratings
- Looking at the events section allows you to confirm that you have created events for your key referral sources
- Instead of digging through numerous reports, all of the most important information is in one location
- Since inclusion in the Top 10 is based on referral ownership, you can confirm that the high volume referral sources are assigned to you, and if not, you can ask for them to be assigned to you
 Details
- Metrics are based on ownership of orders/referrals, not account/contact ownership.
- Events: This area will display your recent or upcoming events. Note that you can click through to events, accounts, contacts and create expenses from this area.
- Clicking on the "View" link will open the Calendar page and open the specific event listed in the row.
Manager’s Overview
A manager’s overview page displays more region or market level data, so that you can easily view your team’s activity at a glance.
Value
- Rather than digging through multiple reports, the most critical referral data is in one place
- You can quickly see top referral sources by branch or territory. This allows you to easily check and confirm that the correct reps are assigned to the top referral sources
- Observing trends and connections will help you to identify coaching opportunities
- Shows the priority sources where your team should spend their time
Details
- The data you see pivots around the branches you assign, not the branches you manage
![]() This is why it is critical that each user profile has the proper branches added
This is why it is critical that each user profile has the proper branches added
Account Administrator's Overview
In general, account administrators can see everything.
Value
- This allows account administrators to check and confirm that territories/branches are set up correctly so that all users see what they need to see on this page
- Account administrators have the ability to assist managers and users by seeing the mass of data available on the Overview page